Reprinted/Coder Bear
Today we continue to talk about the eight model series of data analysis. What is shared today is a model with a simple principle but a wide range of applications: the cohort model. In product analysis, user analysis, channel analysis, all can be used.
First, the principle of cohorts
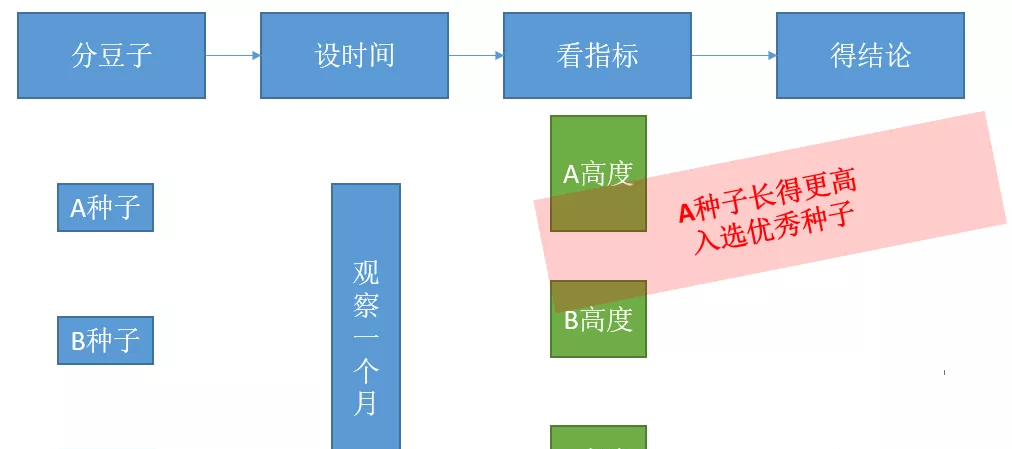
The principle of cohort analysis is simple: grow beans. How to distinguish which kind of beans are good? The easiest way to do this is to divide the groups (so-called "groups") together (the so-called "contemporaneous") and then observe which one grows faster.
To achieve this, we need to:
- Select the object of comparison and classify the classes by criteria
- Select the appropriate comparison metric.
- Start the observation at a point in time.
- Compare indicator differences to identify good/inferior groups
Taking the example of planting beans, the practice of cohorts is as follows:
This idea is very simple, so it is very common in work, and many other names have been derived.
2, Product synchronization group: Product LTV model
Cohort models in commodity analysis, also known as commodity LTV models.
Here's how:
- Set product grades (A, B, C)
- Start observing from the time the product is listed
- Observe the trend of sales/profit after the listing of the product
- Compare each grade of product to see if it meets the average level of that product
- If the performance is better than average, focus on the problem of out-of-stock and ensure supply
- If performance is below average, focus on backlogs and reduce inventories
(Pictured below)

This model is very easy to use! Because many commodities, starting from the listing, are inherently life cycle trends. Through cohort analysis, not only can this trend be simulated, but also a reasonable LTV range can be set for each level of goods, so as to find out whether the sales of goods meet expectations as early as possible. This further controls the inventory situation and maximizes profits (see chart below).
Not only product analysis, but also user analysis can be used.
Third, the same user group: user retention rate model
User cohort analysis, also known as the user retention model.
- Set user segmentation (generally according to the registration time or registration channel).
- Starting from the time of registration, observe the retention rate of this batch of users after each X days.
- Fit the overall trend and predict the number of users retained by the batch after X days.
- Find the most obvious node of retention decline and determine whether to further analyze it.
Because most apps can only meet part of the user's needs, the retention of users is always slowly decreasing. If some nodes are found and user retention is significantly reduced, it means that there are problems with these nodes and require further analysis. At the same time, based on the cohort data, the expected number of retained users can be fitted, which can provide data support for the operation planning service user resources (as shown in the following figure).
Fourth, the user cohort: user LTV model
If the estimated value generated by users is calculated synchronously when predicting user retention, the user LTV can be calculated. Here's how:
- Using the previous method, first calculate the user retention value
- Calculate the user's payment rate and payment amount for each stage
- Total user value = Retained users * Payment rate * Payment amount
Note that ltV calculated in this way actually refers to: the value generated by the user at a specific time. Not strictly full lifetime value. However, considering that the business plan of the enterprise is also done in the annual/quarterly time unit, it is almost the same to only assess the value generated by the user in 3 months/6 months/12 months.
note! In different business scenarios, user payment forms will be different, so it will have an impact on LTV computing.
Common scenarios, such as:
- Ideal: Users pay a fixed amount and proportionally each month (monthly business)
- High before low and high: the more loyal users, the more they buy, the higher they pay (fan-type business)
- High before low: attract users to pay a lot of money in the early stage, and leave it alone (harvesting business)
The corresponding data may be shown in the following figure. When calculating user LTV, you have to pay attention to the paid pattern. If you simply use the "average monthly consumption" indicator, it is likely that the average will mask the real payment situation and mislead the business judgment.
V. Channel Cohort: Channel Quality Analysis Model
If you analyze the user cohort, change the classification dimension to: users who come in from XX channels. It can be further made: channel quality cohort analysis. Common forms are as follows:
- Classify users by channel + advertising time
- Pay attention to the channel + time to enter the user, the subsequent X days conversion rate / payment
- Calculate the consumption generated by users and compare the cost of channel delivery
- For channels that convert well, consider additional delivery
- For channels with poor conversions, reduce budget/rectification delivery measures
Sixth, the inadequacies of the same group
The cohort looks good because it exposes the problem very well. But the cohort does not have the ability to explain the problem, why does the quality of a channel suddenly collapse? Cohorts alone cannot be explained, and other analytical models are needed to explain them.
I am "data analysis is not a thing", sharing data analysis dry goods all year round, and sharing useful workplace skills tools from time to time.