IT Home January 3 news, the Ministry of Industry and Information Technology data show that from January to November 2021, the development of the Internet and related service industries is stable. Enterprise business revenue and operating profits maintained rapid growth; Internet platform services and data services achieved rapid development, information service revenue grew steadily; and many provinces maintained a growth trend.
First, the overall operation
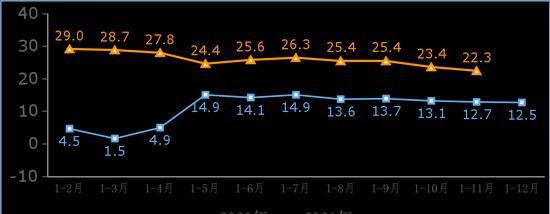
Internet business revenue maintained a rapid growth trend. From January to November, China's Internet and related service enterprises above designated size (referred to as Internet enterprises) completed business income of 1,415.5 billion yuan, an increase of 22.3% year-on-year, the growth rate fell by 1.1 percentage points compared with January to October, and the average growth rate in two years was 17.5%.
Operating profit and operating costs increased simultaneously, and the growth rate declined. From January to November, Internet companies achieved operating profits of 128 billion yuan, an increase of 14.8% year-on-year, and the growth rate fell by 6.5 percentage points compared with January to October. Operating costs increased by 17.3% year-on-year, a growth rate of 3.6 percentage points lower than that in January-October.
R&D expenses have increased steadily. From January to November, Internet companies invested 67.01 billion yuan in research and development expenses, an increase of 5.6% year-on-year, and the growth rate was 3 percentage points higher than that of January to October.
Second, the operation of sub-business
(1) The revenue of information services continued to grow, and the growth of audio and video services was prominent. From January to November, Internet enterprises completed a total of 761.8 billion yuan of information service revenue, an increase of 17.6% year-on-year, an increase of 0.1 percentage points over January to October; accounting for 53.8% of Internet business revenue. Among them, audio and video service enterprises maintained rapid growth; online game companies grew steadily; news and content service enterprises grew rapidly; and the growth rate of business revenue of enterprises providing search services fell back from January to October.
(2) The revenue of Internet platforms has grown rapidly, and the growth rate has declined. From January to November, Internet enterprises achieved platform service revenue of 519.1 billion yuan, an increase of 34.8% year-on-year, and the growth rate fell by 3.2 percentage points from January to October; accounting for 36.7% of internet business revenue, an increase of 3.1 percentage points year-on-year. Among them, the business revenue growth rate of life service platform enterprises has rebounded from January to October. The revenue of enterprises that provide manufacturing and production logistics platform services on the network sales platform and provide manufacturing and production logistics platform services has grown steadily.
(3) The revenue of Internet access services has grown at a low rate, and Internet data services have continued to develop rapidly. From January to November, Internet enterprises completed Internet access and related services revenue of 40.3 billion yuan, an increase of 3.9% year-on-year, an increase of 0.5 percentage points over January to October; completed Internet data services (including cloud services, big data services, etc.) revenue of 24.15 billion yuan, an increase of 28% year-on-year.
Third, the operation of the sub-region
The revenue of Internet business in the eastern region has grown steadily, and the growth rate in the western region has been rapid. From January to November, the eastern region completed Internet business revenue of 1,203.3 billion yuan, an increase of 22.5% year-on-year, and the growth rate fell by 1.1 percentage points from January to October, accounting for 89.4% of the national Internet business revenue (excluding cross-regional enterprises). The revenue of Internet business in the western region was 87.41 billion yuan, an increase of 39.2% year-on-year, and the growth rate was 16.9 percentage points higher than the national average. The revenue of completed Internet business in the central and northeastern regions was 51.12 billion yuan and 4.43 billion yuan respectively, an increase of 2.1% and 6.4% year-on-year, and the growth rate was 0.2 and 0.5 percentage points lower than that of January to October, respectively.
Internet business in many provinces maintained a rapid growth trend. From January to November, Beijing (up 30.6%), Guangdong (up 10.4%), Shanghai (up 35.3%), Zhejiang (up 12.1%) and Jiangsu (up 5.1%) in terms of cumulative Internet business revenue totaled RMB1,123.2 billion, up 22.6% year-on-year, accounting for 83.4% of the country (excluding cross-regional enterprises). There are 25 provinces and cities in the country where the growth rate of Internet business has achieved positive growth, and the growth rate is the same as that of the previous month. The three provinces of Hainan, Yunnan and Tibet grew by more than 50%, and the provinces of Anhui and Jilin fell by more than 15%.
Fourth, the development of mobile applications in China
The total number of mobile apps remained stable. As of the end of November, the number of apps monitored in China's domestic market was 2.72 million, the same as the end of October. Among them, the number of local third-party app store apps is 1.37 million, and the number of Apple Store (China) apps is 1.36 million. In November, 120,000 new apps were added and 120,000 apps were removed.
The number of game apps still leads. As of the end of November, the number of apps in the top four mobile apps accounted for 59.2%, and 10 apps such as other life services and education accounted for 40.8%. Among them, the number of game apps continued to lead, reaching 687,000, accounting for 25% of all apps. The number of daily tools, e-commerce and social communication apps reached 402,000, 274,000 and 251,000, respectively, ranking second to fourth. The number of photo photography and themed wallpaper apps increased significantly from the end of October.
Games, daily tools, social, audio and video applications are among the most downloaded. As of the end of November, the total number of on-shelf app distributions in China's third-party app stores reached 2,092.4 billion times. Among them, the number of downloads of mobile apps for games exceeded 300 billion times, reaching 320.4 billion times. Daily tools, social communications, music videos all had more than 200 billion downloads, reaching 277.1 billion, 252.8 billion and 244.6 billion times, respectively, ranking second to fourth, and life services, news reading, system tools and e-commerce with 191.4 billion times, 159.6 billion times, 151.4 billion times and 141.1 billion times respectively. Among the remaining apps, those that have more than 50 billion downloads include finance (101.5 billion), photography (77.9 billion), and sports health (50.8 billion).
annotations:
1。 In order to more accurately reflect the dynamics of the mobile application market, the monitoring data was changed from "cumulative method (that is, the cumulative calculation method of statistical data)" was changed to "shelf method (that is, statistics are only calculated for shelf applications, excluding off-shelf applications)".
2。 Referring to the app store categories on the market, mobile apps are divided into 14 categories: games, daily tools, e-commerce, life services, social communications, education, themed wallpapers, news reading, sports health, system tools, music videos, finance, photo photography and others.
![The Jiangsu Consumer Protection Commission named app opening advertisements such as Baidu, Douban, Hupu, and Huawei Music[fig]](data:image/gif;base64,R0lGODlhAQABAIAAAP///wAAACwAAAAAAQABAAACAkQBADs=)