WeChat public number: merger and acquisition of Youshu (moneyC2C) debut, more articles can be WeChat to pay attention to our public number: merger and acquisition of Youshu industry chain map
Today, we come to track the cosmetics foundry industry chain:
In the mainland, Guangzhou, known as the "Capital of Cosmetics Foundry", has 373 foundries, which is the first city in the country to have the number of cosmetics foundry enterprises.
The emergence of cutting-edge brands (such as Perfect Diary, New West Mystery, HFP, Huaxizi, etc.) and the acceleration of the layout of foreign brands in Guangzhou have become an important force to promote the prosperity of cosmetics foundries.
At present, according to the statistics of Essence Securities, the output value of cosmetics OEM links accounts for about 10% of the terminal cosmetics industry.
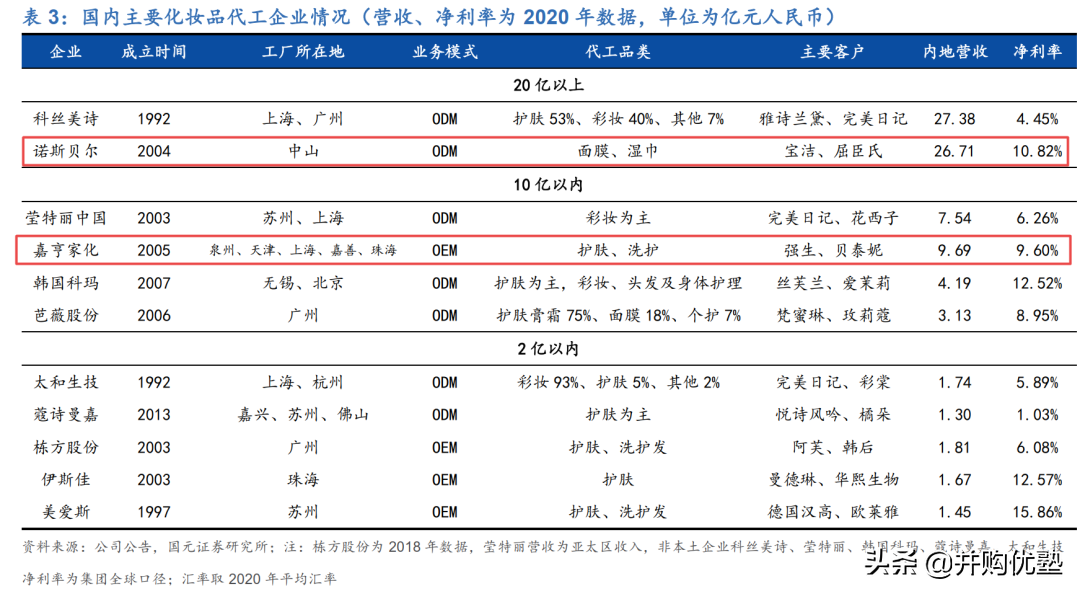
Table: Major cosmetics foundry enterprises in the Mainland
Source: Guoyuan Securities
For the manufacturing foundry related tracks, we have also covered textile and garment foundry, EMS electronic foundry, semiconductor wafer foundry and other industries before, as detailed in the report library of the industrial chain of Youshu. For a manufacturing category, if there are many downstream categories, the competition pattern is scattered, and the product iteration is faster, then its related foundry track will often produce some good business.
For the cosmetics foundry track, the recent growth of participants in the industrial chain:
Jiaheng Jiahua - In the first three quarters of 2021, the revenue was 832 million yuan, an increase of 24.76% year-on-year; the net profit attributable to the mother was 0.6 billion yuan, an increase of -3.39% year-on-year.
Qingsong Shares - In the first three quarters of 2021, the revenue was 2.665 billion yuan, an increase of -3.21% year-on-year; the net profit attributable to the mother was 119 million yuan, an increase of -66.85% year-on-year.
Judging from the expectations of the institution for the prosperity of the industrial chain:

Chart: Institutional consensus expectations for growth and industry prosperity
Source: Tajian Research, Wind
All aspects of the cosmetics foundry industry chain include:
Upstream - cosmetic raw material suppliers, representative companies include BASF, Coase shares, Bloomage Biologics, etc., with gross profit margins between 25% and 35%.
Midstream - cosmetics oem manufacturing and plastic packaging manufacturers, the whole industry chain is relatively lower than the raw material manufacturers and brands. Representative companies include Qingsong Shares, Jiaheng Jiahua, Kosmeshi, etc., with gross profit margins between 10% and 35%.
Among them, the profitability of cosmetics FOUNDRies is relatively low compared with other links in the industrial chain, and at the same time, the industry competition is fierce and the industry concentration is low.
From the perspective of the domestic market, Northbell (under Qingsong Shares) and South Korea's Kosmeshi (China) are located in the leading echelon, with revenue of more than 1.5 billion yuan, ahead of other echelons (the total revenue of Kosmeshi Group is about 8 billion). The second echelon is Koma in South Korea (China), Intre (Intre ) in Italy , and Zhenchen in Shanghai, with an income scale of about 5-1 billion. The third echelon is Bawei shares, Isjia shares, Dongfang shares, Lebao shares, with an income of about 200 million yuan.
Chart: Foundry market situation
Source: Open Source Securities
Downstream - brand owners and channel providers. Among them, brand owners occupy an absolute dominant position in the cosmetics industry chain, representing L'Oréal, Estée Lauder, Bethany, Shanghai Jahwa, etc., with gross profit margins between 60% and 80%.
Figure: Industrial chain structure
Source: Tajian Research
See here, there are a few questions worth thinking about:
1) How big is the cosmetics foundry market? What do you look for in the future growth drivers?
2) From the perspective of key operating data, what kind of business layout can be more competitive in the medium and long term?
This report will be updated to the industrial chain map
(I)
In the field of cosmetics foundry, according to the global scale of 2020, in order: Kosmax (7.446 billion yuan) > South Korea's Coma (7.119 billion yuan) > Intrid (4.5 billion yuan) > North bell (2.670 billion yuan).
In China, overseas companies are ranked according to the income of China, the leading echelon is Kosmeshi, North bell (under Qingsong Shares), and the second echelon is South Korea's Kema, Intreli and so on.
Although the foundry products of several giants cover a comprehensive range, the focus is slightly different:
Cosmex – The dominant category focuses on skin care products (lotions, lotions, creams, masks, essences), but at the same time, it also makes up (base, foundation, concealer, mascara), hair and other categories. Among them, the research and development patents are mainly based on whitening, anti-aging and anti-wrinkle and other functional skin care products.
South Korea's Kema - also based on skin care products, in addition to perfumes, hair care, body care and other categories. R&D patents mainly focus on UV resistance and tanning, multiple functions.
Intralier - with makeup as the advantage of oem categories, before specializing in powder products, the current formation of powder, foundation liquid, automatic pen, foundation, lipstick 6 types of makeup-based makeup. Secondly, nail art and skin care have also begun to cover. Its R&D patents focus on facial makeup and lip makeup.
Northbel - mainly skin care products, the main mask series. The R&D patent focuses on the membrane technology of the mask, and the characteristics of the mask are enhanced with a new membrane.
Figure: Foreign ODM giants have advantages
Source: Essence Securities
The main effect of the mask is to hydrate and moisturize, accounting for about 52% of the total demand for the mask. The iteration of the mask material has also been upgraded from the basic non-woven fabric to silk, TENCEL (innovative Lyocell fiber), hydrogel, and biological fiber cloth (mainly for medical beauty).
Northbell's membranes cover a wide range of masks, including Tencel mask, hydrogel mask, microfiber mask, mineral graphene black mask (deep cleansing, hydration, absorption promotion), nano instant (small molecule hyaluronic acid), double-guide plastic face (one-way double-layer film cloth, using PUR environmental protection technology, pe film and cotton film together a one-way introduction) and so on.
It is worth noting that the Regulations on the Supervision and Administration of Cosmetics will be implemented in 2021, which clearly stipulates that the entrusted production enterprise should have a person in charge of quality and safety, and this person must have more than 5 years of experience in cosmetics production or quality and safety management. Failure to configure as required will result in fines, suspension of production and business, and revocation of licenses.
As of June 2021, there are more than 5,600 enterprises that have obtained cosmetics production licenses (including independent production by brand owners), and the processing enterprises are mainly small and medium-sized.
It can be seen that the introduction of the new cosmetics regulations has put forward strict requirements for the production end of cosmetics and extended the product registration time. Therefore, this will accelerate the tail end of the cosmetics foundry industry out of the clearing, continue to benefit the foundry leader, and the industry concentration is expected to increase.
(2)
Judging from the revenue structures of the two companies compared in this case:
First, Jiaheng Jiahua - starting with plastic packaging containers for daily chemical products, in 2011 cut into cosmetics OEM, with the OEM model as the starting point, into the multinational group daily chemical supply chain.
In 2020, the contribution of cosmetics and plastic packaging containers accounted for almost the same, 38.33% and 39.03% respectively. Among them, domestic revenue accounted for 86.37%, and foreign income accounted for 13.63%.
Chart: Revenue structure (unit: 100 million yuan)
Second, Qingsong shares - starting with the deep processing of turpentine, in 2019, it acquired Northbell, a leading domestic cosmetics ODM/OEM leading enterprise, and cut into the field of cosmetics. Northbell is the world's fourth largest and leading domestic cosmetics ODM company.
In 2020, cosmetics contributed 59.81% of revenue, and turpentine deep processing accounted for 27.14%. In the cosmetics business, facial masks accounted for 25.65% of revenue, wet wipes accounted for 17.11% of revenue, and skin care accounted for 17.05% of revenue.
In addition, domestic revenue accounted for 67.12%, and foreign income accounted for 32.88%.
According to the scale of cosmetics FOUNDRies, Qingsong Co., Ltd. (2.67 billion) > Jiaheng Jiahua (277 million), and Qingsong Co., Ltd. has a larger business scale.
(III)
Next, we'll put together recent quarterly revenue and profit growth to sense the growth trend:
First, the growth rate of income
Chart: Revenue growth rate (unit: %)
In terms of revenue growth, in the past three quarters, jiaheng jiahua's revenue growth rate is much higher than that of Qingsong shares, which is due to differences in income structure. thereinto:
Qingsong shares - since 2020Q1, its revenue growth rate has shown a downward trend, because: 1) the early stage was affected by the health incident, the business was impacted, and the order declined; 2) the early acquisition of Northbell was affected, and the growth rate was higher. In addition, the decline in revenue growth in 2019Q1 is mainly due to the sharp decline in the price of products of the original main business of turpentine in 2019.
Jiaheng Jiahua - The high growth rate of 2021Q1 is due to the low income and low base affected by health events in the same period last year.
Second, the growth rate of net profit attributable to the mother
Chart: Growth rate of net profit attributable to the mother (unit: %)
Overall, the fluctuation of the attributable net profit of the two is consistent with the fluctuation of revenue.
Qingsong shares - 2021Q2-Q3 profit growth rate is negative, mainly because the revenue growth rate is negative, gross profit margin fell sharply.
Jiaheng Jiahua - The negative profit growth rate of 2021Q2-Q3 is due to the increase in labor costs and the increase in expenses during the period, of which the increase in management expenses is larger, due to the increase in employee salaries, leased warehouses and IPO expenses.
(Wanton)
After perceiving the growth trend, we then take apart the revenue and profit of each company and look at the recent financial report data.
First, Jiaheng Jiahua - in the first three quarters of 2021, the revenue was 832 million yuan, an increase of 24.76% year-on-year; the net profit attributable to the mother was 0.6 billion yuan, an increase of -3.39% year-on-year.
1) Analyze from the growth rate of a single quarter:
In the single quarter of 2021Q3, the revenue was 318 million yuan, an increase of 15.66% year-on-year and 20.58% month-on-month; and the net profit attributable to the mother was 0.27 billion yuan, an increase of 1.56% year-on-year and 66.3% month-on-month.
2021Q3 revenue increased year-on-year, mainly due to cosmetics and home care products affected by online promotions, and sales growth drove performance. The increase in net profit attributable to the mother was very small, due to the increase in labor costs and the increase in expenses during the period.
Chart: Single-quarter revenue profit and growth
Chart: Single Quarter Revenue & Attributable Net Profit (Unit: 100 million yuan)
2) Trace the growth of the previous quarters:
The net profit attributable to the mother in 2020Q1 was low, mainly due to the impact of health events, and the overall revenue was low.
The year-on-year growth rate of net profit attributable to the mother in 2021Q2 decreased because labor costs (there were no social security reductions this year) and rising raw material costs dragged down profits.
Second, Qingsong shares - in the first three quarters of 2021, the revenue achieved 2.665 billion yuan, an increase of -3.21% year-on-year; the net profit attributable to the mother was 119 million yuan, an increase of -66.85% year-on-year.
In the single quarter of 2021Q3, the revenue was 754 million yuan, an increase of -21.29% year-on-year, an increase of -25.82% month-on-month; the net profit attributable to the mother was -0.62 billion yuan, an increase of -147% year-on-year, and -169.23% month-on-month.
Note that in terms of revenue, the year-on-year growth rate of 2021Q3 continued to be negative, this is because: on the one hand, the export business was blocked, due to the control of health events and the sharp rise in maritime prices, the export sales of disinfection wipes, non-woven fabrics and other disinfection products declined; on the other hand, the implementation of new regulations on cosmetics has slowed down the overall filing progress of the industry and delayed new products.
In terms of net profit attributable to the mother, the growth rate of 2021Q2-Q3 fell sharply, mainly due to the increase in the cost of cosmetic raw materials, which affected the decline in gross profit margin.
2020Q2 attributable net profit is higher, benefiting from the current period of revenue increase, domestic health events have been controlled, its increase in mask and medical wipes production capacity, product exports; new mask and skin care product production lines, expand the sales of turpentine deep processing business products, while achieving 100% performance of Northbell.
(Wu)
After comparing the growth, let's look at the changes in the profit margin and expense ratio.
First, the cost structure -
Figure: Cost structure
Source: Jiaheng Jiahua Prospectus
Judging from the prospectus disclosure of Jiaheng Jiahua, the higher proportion of cost is direct materials (62%), followed by manufacturing costs (15%) and labor costs (14%). Therefore, the price fluctuations of raw materials and the increase in labor costs will put some pressure on operating costs. (Qingsong shares did not disclose the details of the cost item).
Second, the gross profit margin -
Chart: Gross margin (in %)
Overall, the gross profit margin difference between the two is not large, and the gross profit margin is generally declining, mainly due to the new revenue recognition standard to include transportation costs and packaging fees in the cost, as well as the increase in raw material costs and labor costs.
Among them, the gross profit margin of Qingsong Co., Ltd. in 2021Q3 is lower than that of Jiaheng Jiahua, mainly due to the decline in the gross profit margin of the turpentine business and the cosmetics business, mainly due to the increase in the price of large raw materials in the upstream, in addition, the gross profit margin of the cosmetics business has declined, which is also affected by the slowdown in the filing speed of new products.
Third, the net interest rate -
Figure: Net Interest Rate (Unit: %)
In terms of net margin, the overall volatility is the same as gross margin. Among them, Qingsong shares > Jiaheng Jiahua, mainly the difference in management expense rate, jiaheng jiahua management expense ratio is high.
Fourth, the cost ratio -
Chart: Expense ratio (in %)
Sales expense ratio, R & D expense ratio, the investment of both companies is relatively low, and Qingsong shares are slightly larger than Jiaheng Jiahua. Jiaheng Jiahua in 2020 was affected by the adjustment of the new revenue standard caliber, and the sales expense ratio fell sharply.
However, the management expense ratio of the two is relatively high, and the high jiaheng jiahua is mainly due to the increase in employee salaries (about 47%) and rented warehouses (16%).
V. Return on Net Assets ——
Figure: DuPont decomposition (unit: %, times)
Compared with their respective return performance, Jiaheng Jiahua > Qingsong shares. Apart, jiahengjiahua return in 2020 is slightly higher, mainly due to the high turnover of total assets and equity multiplier.
(Lu)
The market calculation of the cosmetics foundry industry is as follows:
Cosmetics FOUNDRY market size = Cosmetics retail market size× the proportion of FOUNDG of each brand × the proportion of OEM value
First, the scale of the cosmetics retail market
According to Oreh data, the market size of the cosmetics industry in 2020 was 520 billion yuan, an increase of 7.2% year-on-year, and a five-year compound growth rate of 10.3%.
Among them, the skin care market size is 270.1 billion yuan, with a five-year compound growth rate of 10.9%; the makeup market size is 59.6 billion yuan, with a five-year compound growth rate of 18.7%.
So what will be the size of the cosmetics retail market in the next five years? Its core driving force is: the per capita consumption of cosmetics.
In 2018, China has become the second largest consumer of cosmetics in the world, accounting for 12.7% of total global cosmetics consumption, second only to the United States (18.3%).
However, compared with developed regions, the per capita consumption of cosmetics in mainland China in 2020 was 58 US dollars, and the per capita consumption of cosmetics in the United States, Japan and South Korea was 277 US dollars, 272 US dollars and 263 US dollars respectively in the same period, which was only one-fifth to one-seventh of the per capita consumption of consumer goods in developed regions.
At the same time, the per capita expenditure of mainland cosmetics consumption accounted for 0.51% of gdp per capita, lower than the 0.70% and 0.84% levels of Japan and South Korea in the same period. Overall, China's consumption is still at a low level against the global mature cosmetics consumer market.
Chart: Per capita cosmetics consumption in 2018
Source: Cinda Securities
Per capita consumption of cosmetics is highly correlated with consumption levels.
From the perspective of per capita GDP, the per capita GDP of the mainland is 10,400 US dollars, and the per capita GDP of South Korea is 31,000 US dollars, accounting for 33% of the Korean level; and from the perspective of per capita disposable income, the per capita disposable income of South Korea is 112,500 yuan, and the per capita disposable income of the mainland is 32,000 yuan, accounting for 28% of South Korea.
According to the data, more than 60% of netizens spend 200-1000 yuan on cosmetics per month, of which consumers account for a high proportion of 500-1000 yuan, 31.5%.
Chart: The average monthly consumption of cosmetics by Chinese netizens in 2021
Source: Ai Media Consulting
In summary, considering the increase in consumption level driven by the increase in the mainland's per capita GDP in the future, as well as the growth rate of the overall cosmetics industry, we assume that by 2025, the per capita consumption level of cosmetics will reach 33% of the Korean level, which is 86.79 US dollars (about 550 yuan), and its growth rate will be from 9.65% (the average growth rate of the cosmetics industry level and the per capita consumption level) to 6% of the GDP level.
Next, several core growth factors, we dismantled one by one:
。。。。。。。。。。。。。。。。。。。。。。。
The above is only part of the content of this report, and half of the content is reserved for trial reading.
For the full text of this article, as well as more content, please subscribe to: Professional Report Library, Technology Report Library, Industrial Chain Report Library, and Pharmaceutical Report Library. Subscribe to the consultation to add WeChat: bgys2020
Only hard-core analysis can gain insight into the future at critical moments.
【Copyright, Content and Disclaimer】1) Copyright: All rights reserved, violators must be investigated, without permission may not be reproduced, excerpted, copied, reproduced, disseminated. 2) Respect originality: If there is a citation that does not indicate the source, please contact us, we will delete and correct the relevant content. 3) Content: We only do industrial research, in order to serve the construction of the real economy and the development of science and technology for the purpose, this article is based on the attributes of public companies in each industry, according to its statutory obligations to the public disclosure of financial reports, audits, announcements and other information collation, do not adopt non-public information, do not endorse future changes, do not support any form of decision-making basis, do not provide any form of investment advice. We strive to be accurate, but do not guarantee its completeness, accuracy, timeliness, and are not responsible for any individual decisions or market changes. The content only serves the needs of industry research and academic discussion, and does not provide information on the securities and futures market, and does not serve people related to the virtual economy, related persons in the securities and futures market, and people without information screening ability. If you are a related person, please be sure to withdraw your attention to this number and do not read anything on this page. 4) Format: We only present part of the content on WeChat, the format of the title content is determined independently, if there is any objection, please cancel the attention to this number. 5) Theme: In view of the huge workload, only part of the industry is covered, and it is not guaranteed that the industries you need are covered, nor does it accept any form of private consultation Q&A, please understand. 6) Platform: The content is exported to the WeChat platform as the only export, and is not responsible for any other platform, and we reserve the right to legally prosecute the counterfeit and infringing platforms. 7) Completeness: The above statement and the content of this page and all the content of this platform (including but not limited to text, pictures, charts) constitute an inseparable part, without reading and recognizing all the terms of this statement in detail, please do not do any form of browsing, clicking, forwarding, commenting on this page and all the content of this platform.