Let's take a look at their financial statements from 17 to 20 years (unit :)...
BOE A: The world's leading provider of semiconductor display technology, products and services
TCL Technology: Main semiconductor display technology and materials, "top 10 leading global consumer electronics brands"
1. The ratio of accounts receivable to total assets:
BOE A: 17 to 20 years average 6.3%!
TCL Technology: 17 to 20 years average 5.7%!
The lower the ratio of accounts receivable to total assets, the better! 33
This game TCL Technology wins!
2. Inventory turnover days:
BOE A: 17 to 20 years average 49 days!
TCL Technology: 17 to 20 years average 51 days!
The lower the inventory turnover days, the better!
This game BOE A wins!
3. Relationship with suppliers:
BOE A: From 17 to 20 years on average 3.49 billion!
TCL Technology: From 17 years to 20 years on average 8.99 billion!
The higher the value of the relationship with the supplier, the stronger it is!
This game TCL Technology wins!
4. Return on net assets:
BOE A: 4.7% average from 17 to 20 years!
TCL Technology: 17 to 20 years average 7.6%!
The greater the return on net assets, the better!
This game TCL Technology wins!
5. Return on total assets:
BOE A: 2.16% average from 17 to 20 years!
TCL Technology: 17 to 20 years average 2.78%!
The greater the return on total assets, the better!
This game TCL Technology wins!
6. The complete production cycle of doing business:
BOE A: 17 to 20 years average 106 days!
TCL Technology: 17 to 20 years average 96 days!
The lower this indicator, the better!
This game TCL Technology wins!
Let's take a look at their earning power!
1. Gross profit margin:
BOE A: 20.8% average from 17 to 20 years!
TCL Technology: 17 to 20 years average 15.8%!
The higher the gross margin, the better!
This game BOE A wins!
2. Core profit margin:
BOE A: 17 to 20 years average 11.3%!
TCL Technology: 17 to 20 years average 6.9%!
The higher the core profit margin, the better!
This game BOE A wins!
3. Net interest rate:
BOE A: 17 to 20 years average 4.9%!
TCL Technology: 17 to 20 years average 6.1%!
The bigger the net interest rate, the better!
This game TCL Technology wins!
"Finally, let's take a look at the cash flow!
1, operating activities cash flow: operating activities cash flow is greater than zero, and greater than depreciation and amortization, indicating that the enterprise can not only operate normally, compensate for the depreciation and amortization of assets, but also provide funds for the expansion of reproduction of enterprises, and enterprises have potential growth. "
BOE A:
256.80 260.80 392.50 622.70
TCL Technology:
104.90 114.90 167.00 328.80
This game BOE A wins!
2. Profit content: 3
BOE A: From 17 to 20 years on average -878.4%!
TCL Technology: From 17 years to 20 years on average 280.4%!
The more gold content of the profit, the more real the net profit!
This game TCL Technology wins!
3. Cash flow from operating activities to current liabilities ratio:
BOE A: Average from 17 to 20 years is 43.0%!
TCL Tech: Average from 17 to 20 years is 26.1%!
The higher this indicator, the better!
This game BOE A wins!
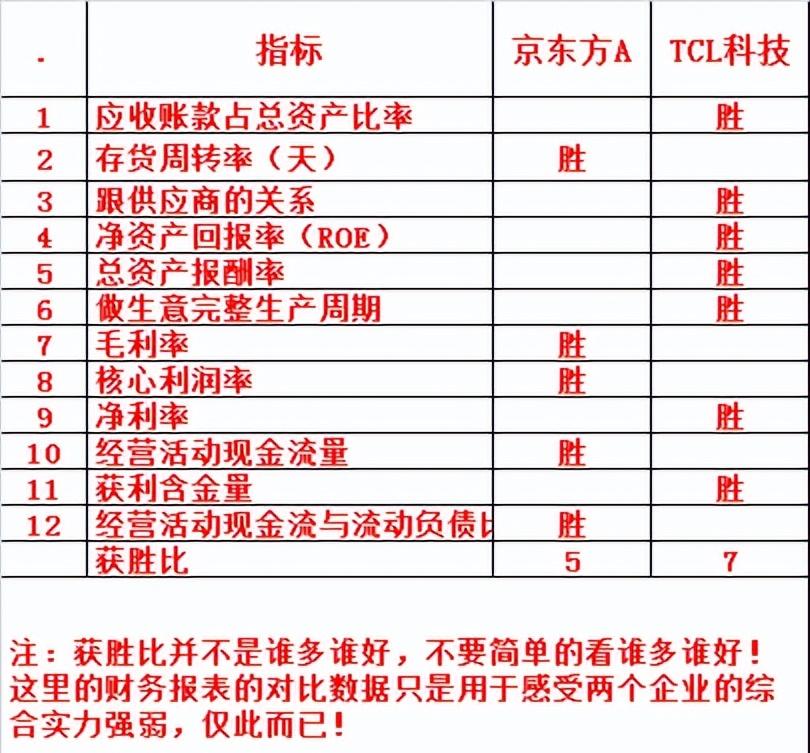

Note: This article is only from the perspective of the financial data of the two enterprises over the years to compare, the indicators are only the indicators that I personally feel are more important to compare, there is one-sidedness, can not be used as the basis for any decision-making.
However, after comparison, there are the following benefits:
1. After comparison, you can feel the comprehensive strength of different enterprises, and it is easy to judge who is superior and who is inferior!
2. After comparing the data, you can filter some enterprises with strong external strengths and middle cadres.
3, consecutive years of financial data is not easy to falsify, encounter all indicators are negative can avoid stepping on the thunder!
Disclaimer: I just stand in the perspective of data processing and exchange and learn with everyone, and I have no intention of targeting any enterprises! "