There are so many ways to design charts,
Today I don't talk about "professional",
Speaking only of the simplest,
The ones you most likely overlook,
It is also one of the easiest tricks to shine.
Once you learn it, your charts will be tall!
The design of commercial charts is multifaceted, but whether it is color matching, or typesetting, layout, it is a process of "painstaking management" around the visual center, and the ultimate goal is to use the visual center to strengthen the theme and strengthen the fun of reading.
However, since there are so many places where the chart can be designed, if each element is designed according to the corresponding standards, the final presentation effect may be very different from the original purpose. Therefore, each element has its own guidelines when designing, but as part of the chart, it should be set in the case of ensuring the overall unity. The main thing should be to achieve the unity of color matching, the unity of format, the unity of name, and the unity of the same content, so that the charts produced are harmonious and standardized.
In addition, because in daily use, it is often not just a certain chart. For the analysis of complex data, it is often multi-angle, and it is necessary to use multiple charts to display (of course, there are not too many charts, too many charts will make people confused). Therefore, we should also pay attention to the consistency of the collocation and style between the charts, and improve the consistency of the theme, so that the overall appearance is more uniform and coordinated, so that the reader can better view and accept the information transmitted.
When there are too many charts, there is a unified standard that will not be dazzling, and it should be unified mainly from the following aspects.
1. Unified chart type
Some chart makers like to use different chart types such as column charts, bar charts, and pie charts to express a type of data, and set various effects for each chart, showing chart skills through various means, resulting in charts looking disorganized.
When encountering such problems, the first step in the resolution is to maintain consistency in the same type of chart in the same scenario. The effect of unifying the chart types for the charts in the preceding figure is as follows.

2. Unified chart appearance
The overall appearance of the chart is not uniform, it will give people an unprofessional impression at the first time, and the reader will even suspect that the content is pieced together from somewhere else. Therefore, a chart in the same file, or a chart illustrating the same problem, must ensure that the length and width of the outside of the chart are consistent and the composition method is consistent. Whether it is arranged up and down, or left and right, the decision is unified and implemented, and the visual order of the direction is strengthened.
If multiple charts are made on a single page, you also need to adjust the position of the charts to align them. In Excel, if you need to nudge the chart, you can first hold down the [Ctrl] key, and then select the chart, then the selected state of the chart is a little different from usual, in this state you can use the arrow keys to nudge the chart, just like the shape of the micro-shift text box.
The effect of unifying the appearance of the chart in the preceding figure is as follows.
3. Uniform color matching
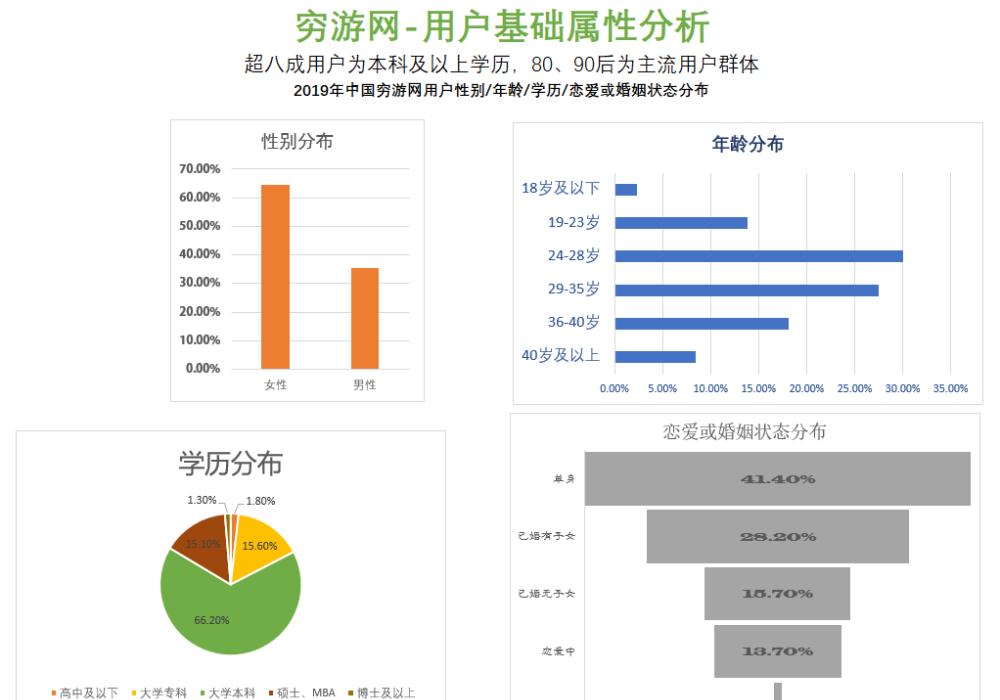
According to the application scenario, the unified color matching of the charts used in the same scene can enhance the design sense of the charts and appear more professional. The chart data shown in the above figure is an analysis of the user attributes of Qyyou.com, so when the unified color matching can be combined with its corporate LOGO to make a choice, the chart effect after completing the unified color matching is as follows.
4. Unified layout
When laying out diagrams used in the same scenario, consider uniformity as well. Including the use of consistent fonts and colors for the same elements in the chart, the spacing, length, width and other content between the objects, as far as possible to achieve "horizontal height, vertical and width", that is, the horizontal arrangement of objects set to the same height, vertical arrangement of objects set to the same width. In the chart shown in the above figure, although all charts use the same chart type, the overall appearance is still not uniform because the size of the plot area is not equal, the thickness of the data series is different, and the size and position of the coordinate axes are different.
First of all, we adjust the font of all elements in the chart to achieve uniformity, and the effect is as follows.
Then adjust the elements contained in the chart to ensure that all the elements are uniformly owned, and the unwanted elements are uniformly canceled, so that the layout is unified, and the effect after completion is as follows.
Then unify the size and position of the elements in the chart, in this case, the size of the plot area of the first chart is mainly adjusted, and the effect after completion is as follows. Now, doesn't it look a lot better?
Now this effect, that is, the width of the data bar has not been unified, we can use the latter method to operate, after the completion of the effect is as follows.
To achieve the unity of multiple charts, it is best to use templates. Make or choose a set of templates with a harmonious overall style, and quickly implement the modification of all charts, including the unification of colors, fonts, and styles. It should be reminded that when making templates, different chart elements should be defined by color, font and style to form a fixed pattern, rather than just defining the overall color, font and style of the chart, and then changing the color, font and style at will when designing the chart elements.