Today, Bo Xiaoyuan will take you together to discuss the problem of protein-protein interaction and software docking by combining the reference paper with the demonstration experiment, hoping to help everyone study protein interaction.
Technical background
In 2005, Wigge et al. reported on Science the signaling regulatory pathway for Arabidopsis thaliana to "induce flowering", in short: there is a FLOWERING LOCUS T(FT) gene in Arabidopsis that encodes proteins that form complexes with a transcription factor FD of the bZIP family, thereby activating the expression of APETALA1 (AP1), where AP1 is the key protein for inducing flowering, and they speculate that this pathway may be conserved in higher plants ( Wigge et al., 2005)。
There is a protein of Hd3a in rice, which has a high homology with Arabidopsis FT. Taoka et al. found that its regulatory mechanism may be similar to that of the Arabidopsis FT-FD-AP1 pathway, so they conducted a series of studies (Taoka et al., 2011). The conclusion of the study can be clearly seen from the following three experimental results.
Experiment 1:
OsMADS15 and Arabidopsis AP1 are highly homologous proteins and are key proteins in rice that induce flowering. OsFD1 and Arabidopsis FD are functionally similar proteins that may be transcription factors for OsMADS15. In the figure below, when the transcription level analysis was performed, it was found that neither Hd3a nor OsFD1 alone could activate the expression of OsMADS15, only when the two coexisted.
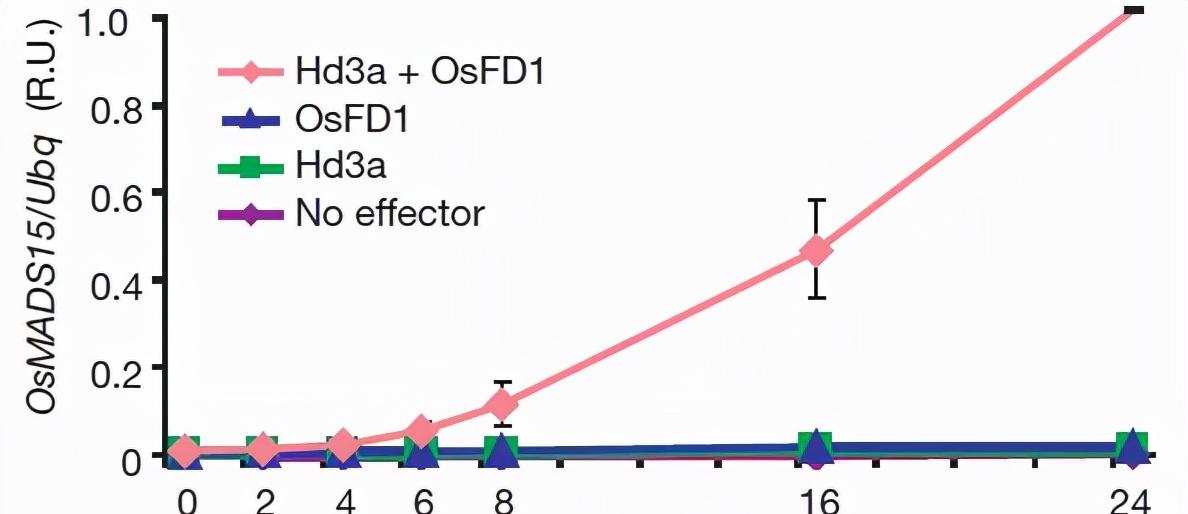
Figure 1 Hd3a and OsFD1 regulate OsMADS15 expression levels.
Experiment 2:
The GST pull-down results show that (Figure 2) that Hd3a interacts with GF14c (also known as 14-3-3c), GF14c interacts with OsFD1, and Hd3a interacts with OsFD1, but also interacts when all three exist at the same time. Therefore, it is inferred that Hd3a's interaction with OsFD1 requires GF14c mediation.

Figure 2 GST pull-down verifies the interaction between Hd3a, GF14c (14-3-3c), and OsFD1.
Experiment 3:
EMSA experiments show that (Figure 3 left), OsFD1 can bind to the promoter of OsMADS15, but only by forming a composite structure with Hd3a and GF14c can transcriptional activation of OsMADS15 be achieved. In summary, the flowering regulatory pathways of rice are: Hd3a is expressed in leaf cells, transported to the tip of the stem, 14-3-3 family proteins as intracellular receptors, binds to Hd3a to form a complex, and enters the nucleus under the action of OsFD1, forming a ternary complex with OsFD1 (Figure 3 right), and the ternary complex can activate the expression of OsMADS15, thereby completing the induction of flowering.
Figure 3 DNA composite structure of HD3a--14-3-3c-OsFD1 in EMSA results and speculation.
Protein-protein docking
Through the above literature analysis, it was found that the focus of the paper is to study the interaction between Hd3a, 14-3-3c, and OsFD1 proteins. If you compare the interplay protein to "couple", then the story is: Hd3a, 14-3-3c love, 14-3-3c, OsFD1 love, but Hd3a, OsFD1 do not love each other. Because of "love" (reciprocity), the three put aside their prejudices and coordinated to achieve the result of promoting "flowering". Our task is to use protein-protein docking software to reproduce this "love story" from a theoretical simulation. First of all, the composite structure of Hd3a/14-3-3c has been parsed by Taoka and the like, and the units have been explained to everyone, we can pretend that their structure has not yet been resolved, and then take the homologous protein of Arabidopsis (or tobacco) as a template to build a three-dimensional structure, and then simulate the interaction process through docking software.
Before docking, first analyze the task. From the cross-sectional view of the binary composite structure reported in the paper (Figure 4), the interaction between Hd3a and 14-3-3c, 14-3-3c and 14-3-3c, 14-3-3c and OsFD1, OsFD1 and OsFD1 may interact, so its interaction is not analyzed.
Fig. 4 3D diagram of the Composite Structure of Hd3a, 14-3-3c, and OsFD1.
1. Prepare the PDB file of the two proteins
For how to get PDB files, Bo Xiaoyuan here first introduces two commonly used methods:
(1) If the structure of the protein of interest already exists in the RSCP PDB database, it can be downloaded directly. If it does not exist, the three-dimensional structure of the protein of interest can be constructed using homologous modeling and de novo prediction software.
(2) AlphaFold2, which was reported in July this year, has performed well in protein structure prediction, and has obtained all predicted proteins for more than 20 species such as humans, rice, Arabidopsis thaliana, and corn, which can be downloaded directly from databases such as UniPort.
What if there are no predicted proteins in the RSCP PDB database and no predicted proteins in AlphaFold2? Don't worry, Bo Xiaoyuan here to introduce you to an online homology modeling method - SWISS-MODEL (URL https://swissmodel.expasy.org/), the method does not require the installation of any software, and if the homology modeling template and the target protein sequence consistency is high (how high is the specific high, in fact, there is no unified conclusion, greater than 60% can already get a high-quality three-dimensional model), then the accuracy of homology modeling will be extremely high , even better than AlphaFold2 predictions.
SWISS-MODEL is the most widely used homologous modeling online software, not one of them, and it's free! It is simple to operate, just fill in the sequence, project name and other information, you can start homology modeling.
Figure 5 SWISS-MODEL sequence submission page.
At the end of the program run, you can view the modeling results in the "Model Results" interface (Figure 6). The three key parameters are:
(1) The quality of the representative model in the hexagon, the closer the value is to 1, the better.
(2) The representation in the ellipse is consistent with the template sequence, and the closer the value is to 100%, the better. In particular, take a look at "Coverage", which represents the coverage of the template to the protein of interest, and the program is modeled only with the parts of the existing structure.
(3) The representative modeling results in the rectangle are generally selected in PDB format.
Figure 6 SWISS-MODEL running results page.
Note: Sometimes the file downloaded from the RSCP PDB database will have the phenomenon of missing amino acid information, resulting in subsequent analysis program errors, you need to open it with SPDBV software first, if it contains a missing sequence, the software will automatically complete; homologous structure modeling or alphaFold2, RoseTTAFold and other software built three-dimensional structural model does not have this problem.
Table 1 Comparison results of the simulated structure with the reference structure
A: Although AlphaFold2 has predicted all the protein structures of rice and Arabidopsis, OsFD1/AtFD is special, they contain a large number of irregular curl fragments (Loop regions), generally in the case of Loop length more than 12 amino acids, without reliable template or restriction information, it is almost impossible to build structures by prediction. The irregular region of OsFD1/AtFD has more than 100 amino acids, and AlphaFold2 has no way. Fortunately, the A123-V177 region of OsFD1 is a conserved α helix and a common domain of bZIP proteins, so peptides in the 123-195 range can be intercepted to predict the results.
According to the information in the table above, we establish the three-dimensional structures of Hd3a, 14-3-3c, and OsFD1 one by one through homology modeling. Since Hd3a and 14-3-3c already have crystal structures, if you run homologous modeling directly, the program will use itself as a template to simulate itself (Figure 7). Therefore, we first perform "Search For templates" at the start of modeling interface, and then select the reference templates in the table to model.
Figure 7 Homologous modeling runtime interface (hd3a as an example).
After completing the modeling, you can compare the accuracy of the model (taking Hd3a as an example) through the online tool SuperPose (URL: http://superpose.wishartlab.com/), as can be seen from the figure below, compared to the crystal structure of Hd3a, the homology modeling is comparable to the accuracy of AlphaFold2, and at the all-atomic level, homologous modeling is even better (the smaller the RMSD, the closer the two three-dimensional structures, Generally all atoms have an RMSD of less than 2, and it is thought that the two structures are very close).
Figure 8 Homologous modeling and comparison of the de novo prediction structure with the real structure.
2. Molecular docking
After the protein structure is prepared, you can enter the docking step! Since protein-protein docking is a very complex thing, there are many influencing factors, and the prediction algorithm has also developed from the rigid docking (ZDOCK) based on the FFTs algorithm at the beginning to the integration of multi-step HADDOCK, ClusPro, SwamDock and so on. Especially in recent years, with the development of machine learning algorithms and the accumulation of experimental data, some interaction prediction algorithms based on co-evolution and homologous proteins have significantly improved the accuracy of protein-protein prediction. Below, Bo Xiaoyuan will introduce two technical routes for everyone:
(1) Method based on ZDOCK-RosettaDock
The ZDOCK-RosettaDock method first performs a rigid docking of two large molecules based on a global algorithm, just like pulling a couple to talk "in person". The process is that one molecule does not move, and the other molecule approaches it from various positions, ultimately selecting the structure with the highest score. However, "the ultimate enemy of hundred steelmaking is not soft around the finger", the docking mode is like the "mate selection standard", which is also different from person to person, when a molecule is close to another molecule, its surface conformation will change, therefore, there is a RosettaDock local fine docking, which allows the docking molecule to select and adjust the conformation.
ZDOCK-RosettaDock method has both a local version and an online version, but the local version is difficult for non-professionals to get started, this article does not introduce in detail, the following only introduces the use of the online version:
1)ZDOCK
ZDOCK needs to provide a school mailbox to use, the specific parameter settings can be referred to. Once you have downloaded the results, check the PDB file to make sure that the "TER" character is added to the end of each structure, otherwise the RosettaDock step may be wrong.
2)RosettaDock
The RosettaDock online server (Lyskov et al., 2008) provides the main functionality of the Rosetta assembly, where "[Docking2]" stands for the RosettaDock module. The website comes with its own instructions, just provide the monomer structure, fill in the peptide chain information, etc., it is very easy to use!
How effective is the above method docking? Bo Xiaoyuan first extracted the heterodimer structure of Hd3a/14-3-3c from the reported Hd3a/14-3-3c composite structure, and then fitted the composite structure obtained by docking with the experimental data, and the results are shown in the following figure.
Fig. 9 Comparison of ZDOCK-RosettaDock docking results with the real structure.
The face is crackling, and the prediction is not at all consistent with the facts (14-3-3c in Figure 9 overlaps, but the real Hd3a and the predicted Hd3a are completely different). What to do? Don't be afraid, we still have routines.
(2) Haddock method based on restriction information
The above docking results are inaccurate because the docking molecules start from a completely random position, and because ZDOCK is a rigid docking software, the scoring is biased towards the larger area of the interplay interface, which may be inconsistent with the facts. If the initial position of the two docking molecules can be obtained, or the amino acid information at the interface of the interaction, the accuracy of the results will be significantly improved. Bo Xiaoyuan introduced the following two situations:
1) Experimental data with restrictive residues Such as the yeast bizyzy results in the article, the R64, P96, F103, R132, and F200, I204, and Y215 of Hd3a may be key residues of the interaction interface, because after they mutate, the double heterozygous results change from positive to negative. If you mark them on the crystal structure, you can see them intuitively (Figure 10). The key residues on these interfaces are called restriction residues in protein docking, and if their information can be obtained experimentally, then the use of HADDOCK for docking is extremely accurate.
Figure 10 Location of the restrictive residue.
2) There is a homologous composite structure for reference
If the structure of a homologous protein has been reported, or a homogeneous complex structure with similar structural function, the two monomer molecules to be docked can be superimposed with the reference complex structure by structural fitting, and then the reference structure can be removed. At this time, the spatial position of the two docking molecules is a good starting position, so that the ZDOCK-RosettaDock docking, or the haddock docking of the restriction residue information can be speculated, and more accurate prediction results can be obtained.
HADDOCK (https://wenmr.science.uu.nl/haddock2.4/) is a very good software that requires registration before use. The software needs to provide information about the two molecules to be docked and the restriction residues, and after adding the restriction residue information of Hd3a and 14-3-3c, the simulated dimer overlaps with the real crystal structure very well (no longer shown in the picture here). In addition, the software allows a large number of parameters to be modified, the flexibility is extremely high, the output content is rich and beautiful, and the software can also be used for practical research. (The website provides instructions for use, and students who are interested in or have needs for protein-protein docking are worth studying carefully).)
3. Interaction analysis of docking results
The ability of two proteins to bind to each other depends mainly on the electrostatic gravitational pull and van der Waals forces between them, including: charge distribution at the interface of interaction, geometric complementary area, hydrogen bond, salt bridge, hydrophobic interaction, aromatic ring accumulation, etc. The physical and chemical principles of protein docking, and the model evaluation method are very complex, and will not be discussed in this article. Bo Xiaoyuan only proposed a general evaluation method for the docking results.
PDBePISA (https://www.ebi.ac.uk/msd-srv/prot_int/pistart.html), the software is very good at analyzing the accessibility and interaction interface of macromolecular solvents, which can be analyzed by entering the RSCP PDB number of the composite structure or uploading the docking composite structure, the use method is very simple, but in the face of the prediction results, how to understand it?
First of all, the key indicators of the information summary column have been charted below, some parameters are as large as possible, and some are as small as possible. There is no clear criterion for judging whether there is interaction, so it is best to use the structure of homologous proteins or homogeneous protein complexes as a reference; secondly, the more hydrogen bonds and salt bridges, the better, the shorter the distance, the better, and there is no reference threshold; finally, PDBePISA has a parameter called the composite structure significance score (CSS), which does not indicate the credibility of the interaction, but refers to the importance of the interface in the formation of the complex, even if CSS = 0, does not represent that there is no interaction between the two molecules, but if CSS >0, there is a high probability that there will be interaction between the two molecules.
Fig. 11 PDBePISA analysis results of the Hd3a/14-3-3c interop interface.
Assembly of ternary complexes
The above series of operations obtains the binary structure of Hd3a/14-3-3c (not shown in the picture), while the ternary structure is that the two Hd3a/14-3-3c binary structures rely on the interaction of 14-3-3c and 14-3-3c, so it is also necessary to build a homodimer structure of 14-3-3c. 14-3-3c homodimer has no restrictive residue information, but its modeling of the high homologous template (tobacco 14-3-3c), has a homodimer crystal structure, so the homologous composite structure can be used for initial guessing of the starting position, after ZDOCK analysis, the simulated 14-3-3c homodimer composite structure is basically the same as the report (picture not shown).
Then, it is the superposition of two binary structures hd3a/14-3-3c, 14-3-3c/14-3-3c, load two structures with SPDBV, select all atoms, perform the "Magic Fit" of the "Fit" menu, you can quickly superimpose the structure (or fit), after repeated fitting the results are shown as follows (Figure 12), almost exactly the same as the article report.
Figure 12 Simulating the obtained Hd3a/14-3-3c composite structure.
Next, it comes to the overlay of the most critical OsFD1. This step is very difficult, because the structure of OsFD1 is inaccurate, the reported crystal contains only 7 residues of OsFD1 189-195, and it cannot fit the prediction results of AlphaFold2, and the method of superposition is completely unworkable. Therefore, only the restrictive information of yeast can be relied on, and HADDOCK can be used to forcibly dock. The final result of all the superposition is as follows, the Hd3a/14-3-3c part is basically the same as the real structure, and the OsFD1 part is quite different from the speculation in the text. Note: Taoka et al. are also based on speculation, their OsFD1 is superimposed with the same type of protein in mice, and may not be a real structure.
Figure 13 The final structure obtained by molecular docking and superposition.
At this point, the "plot" can no longer fully develop according to the "screenwriter's" idea, and this "love story" ends here!
It is not easy to rely on simulation alone to get to this extent, of course, it needs to be admitted that the target protein selected by Bo Xiaoyuan here has a good high homologous template, and there are relevant experimental results as a guide. Without these, the method of prediction is very limited. In order to facilitate everyone to try, most of the methods provided in this article are online versions, if you need to use for research, it is recommended to use the local version, flexible adjustment of parameters, continuous screening, repetition, and with a certain experimental verification, in order to achieve more reliable results.
Summary
Finally, consider the question, why do so many different experiments test the interaction between proteins? It is estimated that some students will answer, which can make the content of the paper look richer and easier to publish. All I can say is, you're such a clever ghost!
If you have carefully read the previous articles of our public account, you may remember that we have compared the advantages and disadvantages of different protein interaction verification techniques, if you only pass one or two verification methods, you may not be able to understand the truth of the facts, and you may also get contradictory results, which is completely normal. In the study of Taoka et al., there are also cases where the results of yeast double heterosis are inconsistent with the results of GST pull-down and nuclear magnetic resonance chemical displacement, which is mainly due to the phosphorylation of OsFD1 amino acid 192, GST pull-down and nuclear magnetic resonance are high-purity proteins expressed using prokaryotics, there is no phosphorylation modification, and there is phosphorylation modification in yeast. However, the authors also used BiFC to verify the results, indicating that OsFD1 and Hd3a may have an interdependent relationship.
Yeast bizyth, BiFC, FERT, Co-IP, GST pull-down, nuclear magnetic resonance, including other technologies not covered in this article, such as protein-protein interaction traps, biofilm interference and other technologies, will vary due to intracellular, extracellular, whether there is protein modification, whether subcellular localization is the same, whether there is third-party participation, mutual strength and weakness, etc. The solution is to set up rigorous controls and use as many methods as possible for verification. As for the students who have forgotten everything, it is very necessary to review the "How many routines do you know about the genetic function research?" (Part 2)."
References:
protein docking. Nucleic Acids Res. 2008, 36(Web Server issue):W233-8.
Purwestri YA, Ogaki Y, Tamaki S, et al. The 14-3-3 protein GF14c acts as a negative regulator of flowering in rice by interacting with the florigen Hd3a. Plant Cell Physiol. 2009, 50(3):429-38.
Taoka K, Ohki I, Tsuji H, et al. 14-3-3 proteins act as intracellular receptors for rice Hd3a florigen. Nature. 2011, 476(7360): 332-5.
Wigge PA, Kim MC, Jaeger KE, et al. Integration of spatial and temporal information during floral induction in Arabidopsis. Science. 2005, 309(5737): 1056-9.