Let's take a look at Fangda Carbon and Del Future today, let's take a look at their financial statements from 17 to 20 years (unit:)...
Fangda Carbon: Graphite electrode leading enterprise, with the country's only new carbon brick production base
Del Future: In the field of new materials, the company's graphene research and development and industrialization applications are based on the graphene research institute and the company's holding subsidiary Xiamen Enecheng Company as the platform, covering the upstream and downstream of the industrial chain; There are 60 million tons of graphite ore under the upstream field holding group, accounting for 12% of the national resources, and ene technology has a 60% market share of vapor deposition graphene preparation equipment in terms of equipment; In April 2019, it established a joint venture with Nobel Laureates to expand the field of graphene smart wear
1. The ratio of accounts receivable to total assets:
Fangda Carbon: 17 to 20 years average 30.3%!
Del Future: 17 to 20 years average 1.8%!
The lower the ratio of accounts receivable to total assets, the better!
This game Del Future wins!
2. Inventory turnover days:
Fangda Carbon: 17 to 20 years average 79 days!
Del Future: 17 to 20 years average 156 days!
The lower the inventory turnover days, the better!
This round of Fang Da Carbon wins!
3. Relationship with suppliers:
Fangda Carbon: Average from 17 to 20 years is 0.5!
Del Future: From 17 to 20 years on average -5.0!
The higher the value of the relationship with the supplier, the stronger it is!
4. Return on net assets:
Fangda Carbon: 9.5% average from 17 to 20 years!
Del Future: 17 to 20 years average 3.1%!
The greater the return on net assets, the better!
5. Return on total assets:
Fangda Carbon: 17 to 20 years average 6.53%!
Del Future: 17 to 20 years average 2.16%!
The greater the return on total assets, the better!
6. The complete production cycle of doing business:
Fangda Carbon: 17 to 20 years average 230 days!
Del Future: 17 to 20 years average 166 days!
The lower this indicator, the better!
Let's take a look at their earning power!
1. Gross profit margin:
Fangda Carbon: 17 years to 20 years average 30.6%!
Del Future: 17 to 20 years average 31.2%!
The higher the gross margin, the better!
2. Core profit margin:
Fangda Carbon: 17 to 20 years average 15.9%!
Del Future: 17 to 20 years average 8.4%!
The higher the core profit margin, the better!
3. Net interest rate:
Fangda Carbon: 9.7% average from 17 to 20 years!
Del Future: 17 years to 20 years average 3.0%!
The bigger the net interest rate, the better!
"Finally, let's take a look at the cash flow!
1, operating activities cash flow: operating activities cash flow is greater than zero, and greater than depreciation and amortization, indicating that the enterprise can not only operate normally, compensate for the depreciation and amortization of assets, but also provide funds for the expansion of reproduction of enterprises, and enterprises have potential growth. "
Large carbon:
0.2006 0.1393 0.1431 0.1994
Del Future:
2.385 2.458 0.6843 0.2923
2. Profit content: .
Fangda Carbon: Average from 17 to 20 years is 40.1%!
Del Future: From 17 years to 20 years on average 135.5%!
The more gold content of the profit, the more real the net profit!
3. Cash flow from operating activities to current liabilities ratio:
Fangda Carbon: Average from 17 to 20 years is 11.9%!
Del Future: From 17 years to 20 years on average 19.9%!
The higher this indicator, the better!
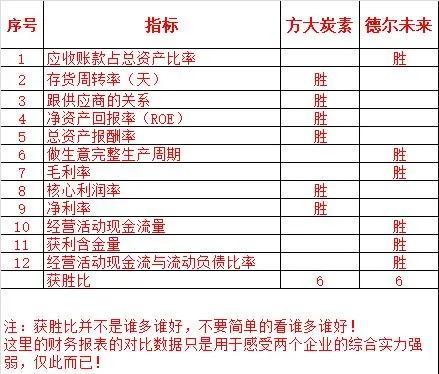

Note: This article is only from the perspective of the financial data of the two enterprises over the years to compare, the indicators are only the indicators that I feel are more important to compare, there is a one-sidedness, can not be used as the basis for any decision-making:
1. After comparison, you can feel the comprehensive strength of different enterprises, and it is easy to judge who is superior and who is inferior!
2. After comparing the data, you can filter some enterprises with strong external strengths and middle cadres.
3, consecutive years of financial data is not easy to falsify, encounter all indicators are negative can avoid stepping on the thunder!
Disclaimer: I just stand in the perspective of data processing and exchange and learn with everyone, and I have no intention of targeting any enterprises! "