November 2023 Data Interpretation: Seeing Clear Signals of Economic Recovery | China Watch
Data released by the National Bureau of Statistics showed that China's economic recovery accelerated in November 2023. Among them, the industrial added value increased by 6.6% year-on-year, up from 4.6% in October. In addition, the year-on-year growth rate of total retail sales of consumer goods also rose from 7.6% in October to 10.1% in November.
Our monthly GDP indicator shows that GDP grew at nearly 8% year-on-year in November 2023, a sharp acceleration from June-October (Figure 1).
Figure 1: Monthly GDP Indicator Growth (YoY)
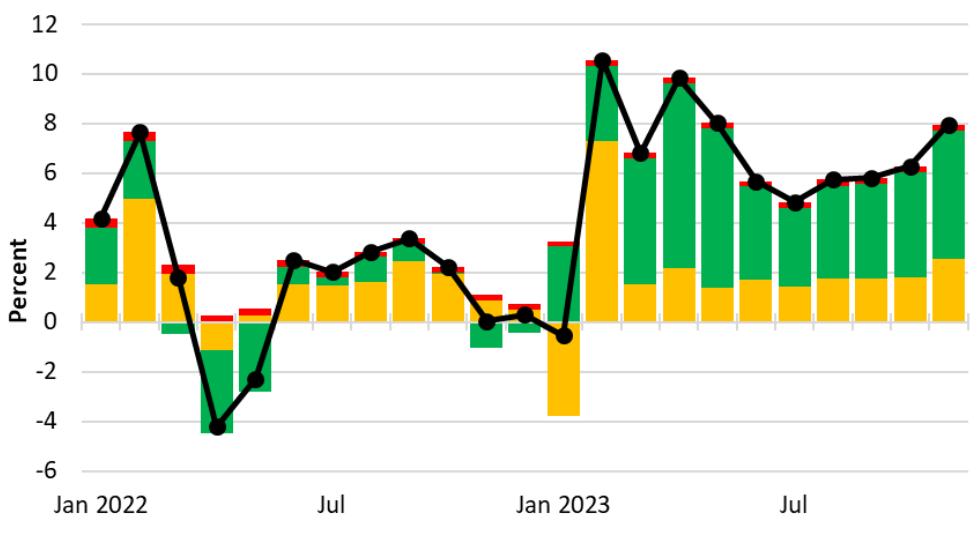
China's economic growth accelerated in November 2023 in part due to last year's low base. As Figure 1 shows, our monthly GDP measure barely grew in November 2022.
What we want to do is take a closer look at this base effect – not only to estimate the actual growth rate of the economy in November 2023, but also to understand the trends that can continue into 2024. A good economist is able to distinguish trends from irrelevant temporary factors. In my experience, this is more of an art than a science.
Fortunately, the INE provides us with the data we need to observe trends in industrial added value. The National Bureau of Statistics (NBS) publishes the month-on-month growth rate of industrial added value every month, with a month-on-month growth rate of 0.87% in November 2023. We can construct an industrial value-added index by selecting a starting point, setting it to 100, and then calculating subsequent data based on the monthly changes provided by the National Bureau of Statistics. Figure 2 shows what the index would look like if we had set January 2022 at 100.
Figure 2: Industrial Value Added Index

The first piece of information provided by the index is the growth of industrial value added over the past 23 months: the average annual growth rate is about 5%, slightly lower than the average growth rate of 6.3% in 2018-2019.
Figure 3 estimates the growth trend of industrial value-added ten times based on 2023 data. The November/January estimate is derived from the annualized rate of the index values for the two months. We calculate this percentage on an annual basis because this estimate is only 10 months, not a full year. The 5.8 per cent estimated over the 10-month period is slightly higher than the 5 per cent derived from the change in the index over the 23-month period. Therefore, it is reasonable that the growth rate of industrial added value in 2023 will be faster than that in 2022.
Figure 3 shows that if we shorten the target period for calculating trends to more recent months, the growth rate picks up, such as 11% in November/October (0.87% annualized). Economists like to say that "one data point doesn't trend" and it is unlikely that industrial production will continue to grow at such a high rate in 2024. As this is the most recent data point, the November/October growth rate reveals something about the future. However, because the time period in which the data is located is too short, it is not possible to make a judgment based on appearances.
So, what is the trend of industrial added value growth?
Here's exactly the trick. From the average trend of the data from April to August 2023, we can derive a figure of 6.5%. To me, this time period seems long enough and new enough. This indicates that the growth rate of industrial value added has fully recovered to pre-pandemic levels, providing a good starting point for 2024.
Figure 3: Growth trend of industrial value-added
The National Bureau of Statistics also counts the monthly changes in total retail sales of consumer goods, so we can make similar adjustments. However, there is also a small problem, although the INE industrial value added is adjusted for inflation, its retail sales data is nominal. I can correct this by dividing the retail sales index by a similar consumer price index. The resulting inflation-adjusted changes and indices are shown in Figure 4.
Figure 4: Inflation-adjusted retail sales index
The real retail sales index looks discrete and jumpy, with a much less linear degree than the industrial value added index, which means that it will be more difficult to identify underlying trends. If we look at the average of the April-August estimates, we get 3.9% (Figure 5), which is lower than the average real growth rate of 5.4% in 2018-2019. Retail sales growth is still below pre-pandemic levels, which seems reasonable, with the current housing market being weak, and sales of big-ticket items such as furniture and appliances linked to new home purchases. As a result, our analysis shows that consumption has not yet fully recovered.
Figure 5: Real retail sales growth trends
Exports and imports are one of the most volatile economic time series. The 12-month moving average curve for China's exports is shown in Figure 6, which eliminates the significant seasonal and monthly biases in these data. In September 2022, China's exports peaked at more than $300 billion. From November 2022 to January 2023, exports fell by 6%, which affected GDP growth.
There are three main reasons for the slowdown in China's exports. First, the tightening monetary policies of major trading partners have constrained aggregate demand, second, the impact of US tariffs on China's exports has been felt over time, and finally, China's exports have grown sharply during the pandemic. As the impact of the pandemic on China's supply chains has been less severe than that of other countries, domestic exporters have been able to fill the global supply shortfall. Last year, China's export surge reversed as production from trading partners resumed.
Despite this reversal, exports in November 2023 were 36% higher than in the same period in 2019. In the past four years, China's exports have grown at an average annual rate of 8%, compared with only 9% in the four years from November 2015 to November 2019, or an average annual growth rate of 2%.
Figure 6: China's Exports (12-Month Moving Average)
The International Monetary Fund's Trade Direction Database provides a different perspective on China's export performance. Statistics as of August 2023 show that China's share of global merchandise trade remains well above pre-pandemic levels, despite the US tariffs on China and the pandemic's "boost" on some merchandise exports fading (Figure 7).
Figure 7: China's share of world merchandise exports (12-month moving average)
How will China's exports perform in the coming months?
The decline in exports has been narrowing since July 2023 and turned to growth in November (Figure 8), suggesting that exports are likely to stabilize in 2024. Central bank interest rate cuts will help China's trading partners recover consumption. In addition, the supply chains of these countries have been fully restored, and China's "pulled" exports will not be further replaced.
Figure 8: MoM change in China's exports (12-month moving average)
The data thing is a bit like the Rorschach inkblot test – everyone sees the same thing in those inkblots. Some good economists tend to argue whether a set of data is increasing or decreasing due to different starting points and time periods of observation.
A closer look at the economic data for November 2023 shows that China's economy will enter 2024 in a fairly good state, despite the challenges.
(Source of the title map of this article: Yicai)
——
Text | Cormac is a senior academic advisor of CBN Research Institute