文章目錄
 tensorflow開發 之數字識别統計
 tensorflow開發 之數字識别統計
# author: [email protected]
import tensorflow as tf

# 讀取資料
mnist = tf.keras.datasets.mnist
(imgTrain, labelTrain),(imgTest, labelTest) = mnist.load_data(path='mnist.npz')
# author: [email protected]
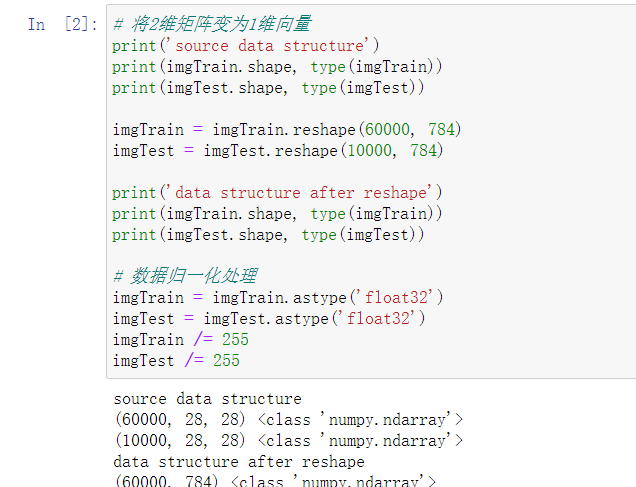
# 将2維矩陣變為1維向量
print('source data structure')
print(imgTrain.shape, type(imgTrain))
print(imgTest.shape, type(imgTest))
imgTrain = imgTrain.reshape(60000, 784)
imgTest = imgTest.reshape(10000, 784)
print('data structure after reshape')
print(imgTrain.shape, type(imgTrain))
print(imgTest.shape, type(imgTest))
# 資料歸一化處理
imgTrain = imgTrain.astype('float32')
imgTest = imgTest.astype('float32')
imgTrain /= 255
imgTest /= 255
# author: [email protected]
# 統計目前實際資料
import numpy as np
import matplotlib.pyplot as plt

label, count = np.unique(labelTrain, return_counts=True)

# 列印數值對應數量
print('0-9各數值對應的訓練樣本個數:')
for m,n in zip(label, count):
print("%d:%d;" % (m, n), end='')
# 繪圖顯示對應數量
fig = plt.figure()
plt.bar(label, count, width = 0.6, align = 'center')
plt.title('0-9 label distruibution')
plt.xlabel('samble data')
plt.ylabel('quantity')
plt.xticks(label)
plt.ylim(0,8000) #設定y軸邊界
for m,n in zip(label, count):
plt.text(m,n, '%d'%n , ha = 'center', va = 'bottom', fontsize = 10)