Let's take a look at the World Show and Tom Cat today, let's take a look at their financial statements from 17 to 20 years (unit: )) ...
TianxiaXiu: Mainly engaged in smart city business and property management business
Tom Cat: Mobile Internet cultural industry business
1. The ratio of accounts receivable to total assets:
World Show: 17 to 20 years average 27.6%!
Tom Cat: 17 to 20 years average 5.5%!
The lower the ratio of accounts receivable to total assets, the better!
This game Tom Cat wins!
2. Inventory turnover days:
World Show: 17 to 20 years average 0 days!
Tom: 17 to 20 years average 28 days!
The lower the inventory turnover days, the better!
This game of the world show wins!
3. Relationship with suppliers:
World Show: From 17 to 20 years on average -2.4!
Tom Cat: From 17 to 20 years on average 1.9!
The higher the value of the relationship with the supplier, the stronger it is!
4. Return on net assets:
World Show: 17 to 20 years average 14.6%!
Tom Cat: 17 to 20 years average -8.1%!
The greater the return on net assets, the better!
5. Return on total assets:
World Show: 9.35% average from 17 to 20 years!
Tom Cat: 17 to 20 years average -3.33%!
The greater the return on total assets, the better!
6. The complete production cycle of doing business:
World Show: 17 to 20 years average 86 days!
Tom: 17 to 20 years average 133 days!
The lower this indicator, the better!
Let's take a look at their earning power!
1. Gross profit margin:
World Show: 26.4% average from 17 to 20 years!
Tom Cat: 17 to 20 years average 66.4%!
The higher the gross margin, the better!
2. Core profit margin:
World Show: 17 to 20 years average 12.8%!
Tom Cat: 17 to 20 years average 38.6%!
The higher the core profit margin, the better!
3. Net interest rate:
World Show: 17 to 20 years average 10.1%!
Tom Cat: 17 to 20 years average -9.9%!
The bigger the net interest rate, the better!
"Finally, let's take a look at the cash flow!
1, operating activities cash flow: operating activities cash flow is greater than zero, and greater than depreciation and amortization, indicating that the enterprise can not only operate normally, compensate for the depreciation and amortization of assets, but also provide funds for the expansion of reproduction of enterprises, and enterprises have potential growth. "
World Show:
0.4554 -0.4761 -1.375 -3.157
Tom Cat:
2.172 7.997 10.63 10.76
2. Profit content: .
World Show: From 17 years to 20 years on average 300.0%!
Tom Cat: From 17 to 20 years on average 61.7%!
The more gold content of the profit, the more real the net profit!
3. Cash flow from operating activities to current liabilities ratio:
World Show: Average from 17 to 20 years is 6.8%!
Tom Cat: From 17 to 20 years on average 37.9%!
The higher this indicator, the better!
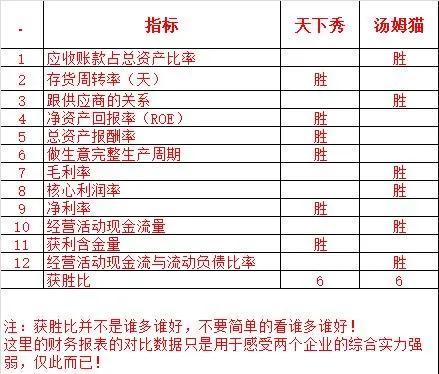

Note: This article is only from the perspective of the financial data of the two enterprises over the years to compare, the indicators are only the indicators that I feel are more important to compare, there is a one-sidedness, can not be used as the basis for any decision-making:
1. After comparison, you can feel the comprehensive strength of different enterprises, and it is easy to judge who is superior and who is inferior!
2. After comparing the data, you can filter some enterprises with strong external strengths and middle cadres.
3, consecutive years of financial data is not easy to falsify, encounter all indicators are negative can avoid stepping on the thunder!
Disclaimer: I just stand in the perspective of data processing and exchange and learn with everyone, and I have no intention of targeting any enterprises! "