Zhongji Preferred Private Equity Fund 50 Index reported in January 2022
(Data as of January 28, 2022)
First, the market review
In January 2022, the domestic A-share market as a whole showed a downward trend, especially in late January, the decline intensified, the market turned cold, and the turnover fell from 1.3 trillion yuan to 800 billion yuan. In terms of industry, the vast majority of industry sectors fell, only the tourism, banking and transportation facilities sectors rose, and the new energy, medical and semiconductor sectors fell significantly. Stylistically, compared with the market average, the small and medium-cap stocks represented by the CSI 500 Index have fallen more, the Shanghai 50 Index has fallen less, and the CSI 300 Index has performed slightly stronger than the average, with a decline between the two. In terms of basis, the basis of the main stock index remained stable, the basis hovered between -5% and 5% annualized most of the time, and the discount at the end of the month was expanded, of which the shanghai 50 index and the CSI 300 index discount range was about 9%, and the CSI 500 index discount was about 5%.
The market continued to fall in January, on the one hand, pessimistic expectations caused by the slowdown in economic growth, and on the other hand, the divergence of monetary policy between China and the United States, which led to market concerns about liquidity. The decision of the Fed's January interest rate meeting shows that the end of bond reduction in the first quarter of this year can be expected to be followed by interest rate hikes and balance sheet reductions. In contrast, China's monetary policy is based on the principle of "steady word, me first", and on the basis of two "interest rate cuts" in December, the central bank lowered the winning interest rate of the MLF in mid-January, announcing on January 20 that the new five-year LPR was 4.6%.
In terms of Hong Kong stocks, under the blow of policies such as the "double reduction policy" of education and the strengthening of supervision by Internet platforms, Hong Kong stocks continued to decline in 2021, and valuations gradually became reasonable, and the investment opportunities of Hong Kong stocks in 2022 were highlighted. In January, the Hang Seng Index performed strongly, and the Hang Seng Technology Index performed slightly weaker, of which the communications and financial sectors rose better, driving the index to strengthen.
In terms of US stocks, the three major US stock indexes experienced a "V" shape in January and have not yet fully recovered their lost ground. The market was a surprise bird before the Fed's more aggressive statement, but then the unexpected non-farm payrolls data and the previous revision prompted the US stock market to rebound and recover most of the losses.
In the commodity market, international crude oil prices rose unilaterally, driven by crude oil supply, weather, oil-producing countries game and currency and other factors, the January WTI03 contract rose from $76 to $87, most of the major LME metals also showed a rally, and the dollar index broke through 97 points in a low in January. The domestic commodity market is mainly rising, industrial products and agricultural products have risen to varying degrees, of which driven by the outer disk, the domestic nonferrous metals, chemicals rose significantly, the black plate rose smaller, and the grain, oil, soft business and feed plates in agricultural products have a certain increase.
Overall, in January 2022, the stock market continued to fall, trading activity decreased significantly, and the main line of the market is unknown, in contrast, the commodity market is dominated by rising.
2. Index performance
(1) Overall situation
1. Zhongji preferred private equity fund 50 index
In January 2022, the Zhongji Preferred Private Equity Fund 50 Index (hereinafter referred to as the "Zhongji 50 Index") performed well. In the context of the decline of A-shares and the differentiation of sectors, the Zhongji 50 Index performed stronger than the CSI 300 Index.
Figure 1: Trend chart of the 50 Index of China Foundation Preferred Private Equity Fund
(July 1, 2019 to January 28, 2022)
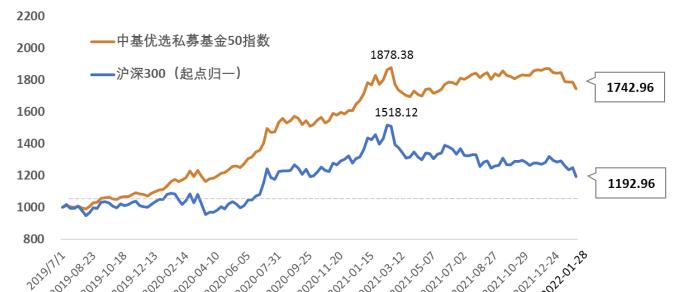
In the past year, the CSI 300 Index has fallen by as much as 18.06%, while the Zhongji 50 Index has only slightly fallen by 4.72%, outperforming the CSI 300 Index and obtaining a 13.34% excess return; since July 1, 2019, the Cumulative Profit of the Zhongji 50 Index has been nearly 75%, more than three times the cumulative return of 19% of the CSI 300 Index, and the excess return has reached 55%.
Table 1: Earnings of The 50 Index of Zhongji Preferred Private Equity Fund

In terms of performance indicators, the annualized yield of the Zhongji 50 Index since the benchmark date has reached 24%, which is more than three times that of the CSI 300 Index in the same period, and the profitability of the Zhongji 50 Index is outstanding; in terms of risk, the annualized volatility of the Zhongji 50 Index is less than 13%, which is significantly lower than the 19% of the CSI 300 Index, and the maximum drawdown is also small, so in the risk-return indicator, the Sharpe ratio of the Zhongji 50 Index has reached 1.78, which is much higher than the Sharpe ratio of the CSI 300 Index of 0.27.
Table 2: Performance of the 50 Index of China Foundation Preferred Private Equity Fund
In summary, as the flagship index of the "Zhongji Preferred Private Equity Index (Series)", the Zhongji 50 Index shows relatively high returns, relatively low volatility and drawdown, and its long-term excess returns are sustainable, reflecting the performance of excellent private placements under the balanced allocation of large-scale strategies and secondary strategies.
2. Zhongji prefers the 50 prudent index of private equity funds
The first secondary index of the China Foundation 50 Index, the China Foundation Preferred Private Equity Fund 50 Prudential Index (hereinafter referred to as the "China Foundation 50 Prudential Index"), has a base date of January 1, 2020, and the index performed well during January 2022.
Figure 2: Trend chart of the 50 Prudential Index of China Foundation Preferred Private Equity Fund
(January 1, 2020 to January 28, 2022)
In January 2022, the Zhongji 50 Prudential Index fell slightly by 1.41%, but still maintained a profit of 2.86% in the most recent year, while the CSI 300 Index fell by 7.62% in January and 18.06% in the latest year.
Table 3: Returns of the 50 Prudential Index of China Foundation Preferred Private Equity Fund
The Zhongji 50 Prudential Index targets solid returns. In terms of risk indicators, the annualized volatility of the index since its inception is less than 8%, and the maximum drawdown is not more than 4%; in terms of returns, the cumulative return of the Zhongji 50 Stable Index is more than 50%, the annualized yield is about 22%, and the Sharpe ratio is close to 2.6.
Table 4: Performance of the 50 Prudential Index of China Foundation Preferred Private Equity Fund
In summary, the Zhongji 50 Robust Index has the characteristics of high profit certainty, low volatility and small drawdown, and shows high performance stability, which is in stark contrast to the performance of the CSI 300 Index. Invest in the Zhongji 50 Prudential Index Fund, and obtain a stable income that is very promising, and the yield of the fund can become the yield of the basic people.
(2) Monthly performance
In January 2022, the CSI 300 index fell by 7.62%, and the Middle Base 50 index fell less at 5.63%.
In the 31 months since July 2019, the Zhongji 50 Index has outperformed the index for 20 months, especially in the 14 months when the CSI 300 Index has fallen, the Zhongji 50 Index has outperformed the CSI 300 Index.
Figure 3: Monthly performance of the 50 Index of China Foundation Preferred Private Equity Fund
Since July 2019, the CSI 300 Index has risen for 17 months, with a cumulative increase of 61%, and the Zhongji 50 Index has risen by nearly 55% in these months, which has captured nearly 89% of the increase of the CSI 300 Index in proportion, indicating that the Zhongji 50 Index has almost completely obtained the return when the CSI 300 Index rose, showing excellent earnings capture ability.
Table 5: Monthly performance statistics of the 50 Index of China Foundation Preferred Private Equity Fund
In the 14 months of the decline of the CSI 300, the Zhongji 50 Index has all outperformed the CSI 300 Index, and 9 of them have "bucked the market" to rise. In the past 14 months, the cumulative decline of the CSI 300 Index has reached 40.84%, and the "reverse market" of the Zhongji 50 Index has obtained a cumulative positive return of 3.24%, showing excellent defensive ability.
Looking at the 50 index from the two parts of the rise and fall of the CSI 300 index, it can be found that the 50 index of the middle base obviously shows the characteristics of "more with the rise, less with the fall".
In January 2022, the CSI 300 index experienced a moderate decline, which is relatively rare since the base date of the Zhongji 50 Index, a total of 6 times, and the Performance of the Zhongji 50 Index is stronger than that of the CSI 300 Index, which means that even if the market conditions are not good, the Zhongji 50 Index can obtain excess returns.
Among these 6 times, the Zhongji 50 Index and the CSI 300 Index both have a considerable decline in only 3 times, in addition, the Zhongji 50 Index has 1 slight follow-up and 2 counter-trend rises, which can show to a certain extent that during the market decline, the Zhongji 50 Index has the ability to continue to obtain excess returns. If the market is extremely deduced, it is foreseeable that the Zhongji 50 Index will eventually be extremely tailai.
3. Ingredient performance
(1) Sub-strategy performance
In January 2022, among the three types of strategies of the Zhongji 50 Index, CTA and derivative strategies contributed the most, reaching 0.51%, and both the stock long strategy and the hedging strategy lost money.
Figure 4: Performance of the 50 Index Sub-Strategies of China Foundation Preferred Private Equity Funds
Table 6: Performance contribution of 50 index sub-strategies of China Foundation Preferred Private Equity Fund
Recently, the upward momentum of high volatility stock long strategies has slowed down, at the same time, the CTA and derivatives strategy curves have recently risen in a stepwise manner, and the combination of the two has reduced volatility, long-term stable operation can be expected, and hedging strategies have also run smoothly as always. From the perspective of historical fluctuations, the stock long strategy has the characteristics of high volatility and strong aggression, the volatility of the CTA and derivatives strategy is in the middle, the income is more explosive, it can neutralize part of the fluctuation of the stock long strategy, coupled with a more stable performance of the hedging strategy, the low correlation strategy configuration improves the defensive ability of the index.
In January 2022, of the three types of strategies of the Zhongji 50 Prudential Index, CTA and derivatives strategies contributed 1.22%, and stock long strategies and hedging strategies lost 2.32% and 0.31% respectively.
Figure 5: Performance of the 50 Prudential Index sub-strategy of The Preferred Private Equity Fund
Table 7: Performance Contribution of the 50 Prudential Index of China Foundation Preferred Private Equity Fund
In the long run, the hedging strategy with weights occupying half of the country has steadily risen upwards, and the balanced allocation of stock long strategies, CTA and derivative strategies have formed complementary trends in the near future, and the combination of the two has reduced volatility while obtaining returns. Overall, as the "ballast stone" of the index, the hedging strategy and the CTA and the derivatives strategy and the stock bull strategy form a differentiated fluctuation, and jointly promote the long-term stable trend of the Zhongji 50 stable index.
(2) Fund relevance
Compared with the CSI 300 Index, the Zhongji 50 Index has a relatively excellent performance in terms of return and risk indicators, which is mainly due to the low correlation between the three major strategies of the Zhongji 50 Index, the correlation between the two of the three types of strategies is up to 0.4, which belongs to the medium and low correlation level, and the two types of strategies with the lowest correlation are stock long strategies and hedging strategies, and the correlation coefficient is as low as 0.13. On the whole, the low correlation between strategies makes the performance of the three types of strategies have a certain complementarity in volatility, which is conducive to reducing the volatility of the index, and the positive return part of the strategy will be superimposed, so that the middle base 50 index can obtain returns in a relatively low volatility manner, and the risk-reward ratio of the index will be relatively improved.
Figure 6: Correlation coefficient between the major strategy classes of the Mid-Base 50 Index
The correlation of funds in various types of strategies is also low, the performance of equity strategies due to the common factor of systemic risk, the average correlation coefficient of the constituent funds in the group is 0.61, which is at a relatively low level; the average of the correlation coefficients of the hedging strategies, CTA and derivatives strategies of the constituent funds in the group is 0.22 and 0.39, respectively, all of which are at a low positive correlation level, such a low intragroup correlation is the result of the differentiated allocation of the secondary strategy, so that the risk is dispersed to a large extent. This is the main reason why the Medium Base 50 Index has achieved a relatively high Sharpe ratio.
Overall, the correlation between the medium-base 50 robust index strategies is not high, and the correlation between the two-two strategies is not more than 0.4. The low correlation between strategies stems from the difference in policy logic and the "selection and configuration" link, which is the pillar of the long-term stable performance of the Medium Base 50 Robust Index.
Figure 7: Correlation coefficient between the major strategies of the medium-base 50 robust index
The correlation coefficient of funds in the large strategy group is not high, the performance correlation coefficient of the constituent funds in the hedging strategy group is 0.22, the performance correlation coefficient of the equity long strategy component fund is 0.55, which is not high after removing the systemic impact, and the correlation coefficient between the CTA and the derivatives strategy group is 0.46.
(3) Performance of constituent funds
In January 2022, 9 of the 50 constituent funds rose in net worth. Of the three types of strategies, most constituent funds under CTA and derivatives strategies are profitable.
Table 8: Performance statistics of the constituent funds of the Mid-Base 50 Index in November
In terms of secondary strategy, alternative strategies under the stock long strategy are profitable, alpha strategies under hedging strategies perform better, and alternative strategies in CTA and derivative strategies have a certain range of profits with medium- and long-term strategies at volume price.
illustrate
1. The Zhongji Private Equity 50 Index and trend chart, updated weekly (released as of the end of last week), can be consulted on the official website of China Fund News (website https://www.chnfund.com/), the official WeChat public account, the official APP related columns, and the relevant weekly, monthly, quarterly, semi-annual, annual reports and other fixed reports will also be disclosed through the above media channels.
2. If the private equity institution intends to participate in the future fund selection, it can send the company, products and other materials to the [email protected], and we will arrange follow-up docking.
Related information
1. "Big Events in the Investment Circle!" China Fund News Private Equity Index officially released! 》
2. Instructions for the Compilation of the 50 Index of China Foundation Preferred Private Equity Fund
3. "Ten Questions and Ten Answers to the Zhongji Private Equity 50 Index"
4. "Investment Circle Events!" Just now, the China Fund News Active Index: Zhongji Private Equity 50 Prudential Index was officially released! How is it compiled? How does it perform? Authoritative expert analysis, ten questions and ten answers to understand all"
5. Instructions for the Compilation of the 50 Prudential Index of China Foundation Preferred Private Equity Fund
6. "Ten Questions and Ten Answers to the Zhongji Private Equity 50 Prudential Index"
Risk Warnings and Statements
1. The copyright of this report belongs to "China Fund News", without prior written authorization, no institution or individual may make any form of reproduction, forwarding, reprinting, quoting, modifying, imitating, publishing, or using in any other way to infringe the copyright of this newspaper. Quotations and publications authorized in writing shall indicate the source as "China Fund News", and shall not make any abridgements or modifications contrary to the original intention of this report. If this report is published or forwarded without authorization, China Fund News will reserve the right to pursue legal responsibility.
2. The contents of this report are for reference only and do not constitute the basis or recommendation of any securities, financial products or other investment instruments or any trading strategy. China Fund News strives to be objective and fair in its report, but does not guarantee its accuracy or completeness. China Fund News does not assume any legal responsibility for any losses caused by the direct or indirect use of this material or any content therein.
Copyright Notice