Summary of the report
Report Date: September 13, 2021
★ The United States is the world's largest producer and exporter of ethanol
As of January 1, 2021, there were a total of 197 fuel ethanol producers in the United States with a production capacity of 17.546 billion gallons. U.S. fuel ethanol production in 2018 and 2019 was 16.1 billion gallons (an all-time high) and 15.78 billion gallons, respectively, and in 2020, production affected by the COVID-19 pandemic fell to 13.926 billion gallons. The United States has a small amount of ethanol imports, is the world's largest ethanol exporter, but the proportion of exports basically does not exceed 10%, the vast majority of ethanol is consumed in China. Fuel ethanol is mainly added to gasoline for road transportation, and the current proportion of additions in the United States includes E10, E15 and E85, but the average proportion of addition is about 10%.
★EPA guarantees renewable fuel usage targets through RINs
The policy has a significant impact on U.S. ethanol demand. Strictly speaking, FRS does not directly stipulate the yield of corn ethanol, assuming that the production of advanced biofuels just meets the RFS requirements, then the production requirements of traditional biofuels (i.e., corn ethanol) are indirectly calculated by subtracting "all renewable fuel production targets" and "advanced biofuel production targets". The EPA uses the RINs system to ensure renewable fuel usage targets. After research, it is found that the price of RIN-D6 is mainly affected by the profit of ethanol blending, the price of RIN-D4 and policy factors.
★ Policy determines whether there can be an increase in demand for corn from U.S. ethanol production
At present, in the consumption of corn in the United States, feed consumption accounts for about 40% of production, the amount of corn used to produce ethanol accounts for about 35%, and exports account for about 15%. U.S. corn feed consumption has been stable for many years, and corn ethanol production provides additional demand increases. But a decision by the D.C. Circuit in early August could prevent gasoline retailers from selling E15s year-round. Following the DC Circuit decision, RFA expects E15 sales to be roughly flat in 2022-2024 at 2021, with the non-permitted E15 full-year sales expected to reduce total E15 sales by 12.6 billion gallons in 2021-2024 compared to allowing full-year E15 sales, corresponding to a 630-000-gallon decline in ethanol sales and a 221 million-2024 decline in corn demand.
The full text of the report
1 Current status of global use of fuel ethanol
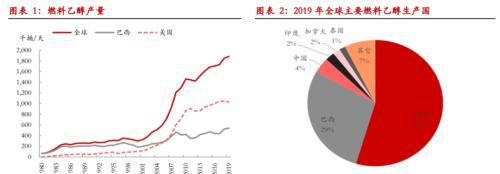
Over the past 40 years, global fuel ethanol has developed rapidly, with fuel ethanol production increasing from 64,600 bpd in 1980 to 1,885,700 bpd in 2019. Among them, the United States and Brazil are the two countries with the earliest development of fuel ethanol and the largest production at present. According to EIA data, fuel ethanol production in the United States in 2019 was 1,029,300 barrels per day, and Brazil was 540,900 barrels per day, accounting for 55% and 29% of the world's total, followed by China, India, Canada, Thailand, France, Argentina, Germany and other countries.
Ethanol, commonly known as alcohol, is a flammable, volatile, colorless transparent liquid at room temperature, with low toxicity, which is very suitable for use in internal combustion engines. Virtually any plant matter can be used to make ethanol, but currently the production of fuel ethanol from corn and sugar cane is the most massive. Brazil mainly produces sugarcane ethanol, and the United States mainly produces corn ethanol. This paper mainly takes corn ethanol as the research object, focuses on the development history, policy evolution, production process, production consumption, import and export of ethanol in the United States, and elaborates the impact of the development of ethanol in the United States on corn demand.
2 History and policy evolution of corn ethanol in the United States
2.1, the background of the development of corn ethanol in the United States
Energy is equivalent to the blood of the city, and in the operation of the modern economy, energy has an undeniable strategic position. For any country, "energy independence" often means a greater advantage. Fuel ethanol is a kind of energy, the first attempt to use fuel ethanol in the United States in 1826, the first fuel ethanol production plant was built in 1940, but the fuel ethanol industry really emerged in the United States after the 1970s.
The first oil crisis
Since the Industrial Revolution, coal has become the world's most important energy source until it was replaced by oil in the 1950s. Against this backdrop, in September 1960 the major oil-producing countries in Asia, Africa and Latin America established the Organization of the Petroleum Exporting Countries (OPEC) to coordinate the oil policies of its member states and ensure stable revenues for oil-producing countries. OPEC is the main source of U.S. oil and petroleum products imports, and 64.58% of U.S. oil imports in 1973 came from OPEC. When the Fourth Middle East War broke out in October 1973, Egypt and Syria went to war with Israel to regain the land they had lost in the Third Middle East War. The enormous material and equipment provided by the United States to Israel during the war infuriated the Arab states. In order to crack down on Israel and its supporters - the United States, the Netherlands, Japan, etc., OPEC announced production cuts, raised oil prices, oil embargo, oil prices rose from $3 / barrel to more than $11 / barrel, causing great harm to the economic development of the United States. It is precisely because of this that governments around the world hope to reduce their dependence on oil in other countries, rekindle interest in the development of fuel ethanol, and open a chapter in the large-scale use of renewable energy sources such as ethanol.
Second oil crisis
The political turmoil in Iran at the end of 1978 was followed by the outbreak of the eight-year Iran-Iraq War in September 1980. The Iran-Iraq war has caused widespread damage to the economic facilities of the two countries, including oil fields, and oil production and exports have plummeted, and international oil prices have risen from a maximum of $14/ barrel to nearly $37 / barrel. The United States imported 554,000 barrels per day of oil from Iran in 1978, which fell to 297,000 barrels per day in 1979, and imports basically fell to zero after the outbreak of the Iran-Iraq War. The second oil crisis made the United States finally determined to develop new energy sources, and the United States began to issue various bills to promote the development of domestic fuel ethanol from the late 1970s.
The harm of tetraethyl lead and MTBE additions is gradually emerging
During the same period of the second oil crisis, the dangers of using tetraethyl lead as an additive to gasoline gradually became apparent. Tetraethyl lead was once widely used as a gasoline additive to improve engine knock resistance. However, tetraethyl lead is highly toxic, inhaled, ingested, absorbed through the skin can cause central nervous system diseases, and is a huge harm to human health. As a result, since 1975, the United States began to reduce the amount of leaded gasoline year by year, and in 1986, it was completely banned, and MTBE (methyl tert-butyl ether) was used as an anti-explosive agent in unleaded gasoline. However, due to the pollution of groundwater by MTBE, most states in the United States banned MTBE in 2000-2007, and fuel ethanol became the only gasoline additive. Coupled with the U.S. government's direct financial subsidies of more than 45 cents/gallon for fuel ethanol producers in 2004, fuel ethanol ushered in a golden period of development in the United States.
Consumption of corn and support of the corn ethanol industry
The highly modern agricultural production methods in the United States have led to an increase in corn yields and yields year after year. U.S. corn production in 2019/20 was 360 million tonnes, accounting for about one-third of global production. The consumption of corn as feed, seeds and food in the United States is growing slowly, and the development of corn ethanol will help promote rural development, improve farmers' income levels, and regulate fluctuations in food supply and demand. Environmental friendliness is also a consideration in the U.S. efforts to encourage the development of corn ethanol, which can help reduce emissions of carbon dioxide, particulate matter and many other harmful substances.

2.2. U.S. corn ethanol industry policy and regulatory mechanism
Over the past few decades, the U.S. government has reached a high degree of agreement on supporting renewable fuels. Corn ethanol in the United States has become a scale from the rise to the present, which is inseparable from the support of various policies of the US government.
To encourage the use of ethanol gasoline, the Energy Tax Act of 1978 exempted ethanol gasoline from a 4 cent/gallon excise tax, and the signing of this act led to the rapid development of gasoline mixed with 10% fuel ethanol and the fuel ethanol industry.
The Clean Air Act, first passed in 1963, is a U.S. federal bill designed to control air pollution. The Act made significant amendments in 1970, 1977 and 1990 to explicitly require regulatory controls on air pollution. The 1970 amendment significantly expanded the powers of the federal government, and in December 1970, the Environmental Protection Agency EPA was established, and the Clean Air Act was administered by the EPA and implemented by states, local governments, and departments. The 1990 amendments established new gasoline standards to reduce harmful exhaust emissions from U.S. motor vehicles, requiring the use of oxygenators as gasoline additives, with MTBE and ethanol being the most important gasoline additives. After MTBE polluted groundwater was banned, fuel ethanol became the only gasoline additive.
The Energy Policy Act of 2005 requires the United States to produce 7.5 billion gallons of renewable energy annually by 2012 to ensure energy security in the United States. In 2007, the U.S. Congress passed the Energy Independence and Security Act, which requires annual renewable energy production to be increased to 36 billion gallons by 2022. The Renewable Fuel Standard Program (RFS), which we are familiar with, is developed and implemented by the EPA under the Energy Policy Act, which further expands the scope of RFS implementation. The Renewable Fuel Standards Scheme, a plan to increase the total amount of renewable fuels blended in transportation fuels, was officially implemented on 1 September 2007. Each year, the EPA divides the total planned production of each renewable fuel by the estimated gasoline and diesel sales for the current year according to the current year's production requirements to determine the approximate annual percentage standard. This percentage is multiplied by the actual sales volume of gasoline and diesel by the obligor (refinery, importer) to determine the statutory renewable volume obligation (RVO) for each enterprise. The EPA tracks whether a company has fulfilled its renewable fuel obligations through renewable fuel identification numbers (RINs).
In addition, the United States has also formulated tax credit policies to encourage the development of the domestic ethanol industry. From 1980 to 2011, the United States imposed a 54 cent/gallon tariff on sugarcane ethanol imported from Brazil. However, due to the small results, in 2004 the U.S. government decided to directly provide fuel ethanol producers with a tax credit of 45 cents/gallon, the first 15 million gallons of fuel ethanol for small and medium-sized producers can receive an additional 10 cents/gallon tax credit, and manufacturers who produce fuel ethanol from cellulose can receive a tax credit of $1.01/gallon. This series of preferential tax policies has directly led to the rapid growth of fuel ethanol production in the United States. Currently, the U.S. production of corn ethanol is no longer eligible for tax credits, but for facilities such as gas stations that install and sell E85 ethanol by December 31, 2021, the law allows for a 30% (capped at $30,000) credit.
In 2007-2008, most U.S. states introduced laws requiring 10% ethanol to be added to the gasoline sold, and the increase in the proportion of additions required a modification of the fuel system of conventional engines, and the use of E85 as fuel required an increase in the number of flexible fuel vehicles (FFVs). In March 2009, the U.S. Fuel Ethanol Association formally filed an application with the EPA to allow the addition of 15% ethanol to gasoline. On October 3, 2010, the EPA passed a bill allowing E15 to be sold in the United States. Cars produced after 2012 can use E15 as fuel. The Open Fuel Standard Act of May 2011 was endorsed and put on the agenda by both houses of Congress. The bill stipulates that 50%, 80% and 95% of the cars sold in 2014, 2016 and 2017 must be cars that can not be fueled by gasoline.
3 Corn processing technology
Carbohydrates in fibrous raw materials (such as softwood), non-starch polysaccharides, sugar cane, and glucose in sugar beets can all be used to produce fuel ethanol, and corn is the main raw material for the production of fuel ethanol in the United States. Fuel ethanol production can be divided into dry grinding and wet grinding, and the types and compositions of the by-products obtained by the two processes are different.
3.1, dry grinding method
Dry milling techniques first require crushing corn pellets, and particle size affects ethanol yield, so producers tend to use finer corn milled to maximize ethanol yield. After crushing and grinding, water and enzymes are added to the corn flour to enter the cooking and saccharification process. Steaming is to decompose starch into glucose, the cooking system is divided into batch and continuous cooking system, the difference between them is that in the corn flour, water, enzyme mixing this link, the former is carried out independently in batches, the latter is continuous. The production efficiency and raw material utilization rate per unit time of batch cooking are lower, but the yield of ethanol is relatively higher. Fermentation refers to the process of yeast converting glucose into ethanol, after fermentation is completed, ethanol is collected with distillation columns; ethanol collected from the fermentation system is contaminated with water, so the water must be removed using a molecular sieve system to obtain purified ethanol. It is common to add a 1% denaturant (such as natural gasoline) to absolute ethanol to make it undrinkable, while also avoiding paying alcoholic beverage taxes.
In addition to fuel ethanol, the main by-products produced by dry grinding method include corn oil and DDGS. The remaining water and solids after ethanol distillation become the total distillate, which is separated by centrifugation into solids and liquids (thin distillates), in which corn oil can be extracted. Ethanol plants can use the "one-step method" or "two-step method" to extract corn oil, "one-step method" is to use centrifugal method to separate corn oil from thin distillates, and then the concentrated distillate obtained can also be heated again to centrifuge to extract corn oil; "two-step method" is to add an additional link on the basis of the "one-step method", that is, a large amount of corn oil can be extracted from the total distillate. In addition to corn oil, another major by-product is DDGS (Distillers Dried Grains with Solubles), which can be widely used in animal feed because of its high energy and protein, which can replace part of the energy feed (corn) and protein feed (soybean meal).
In the United States, the dry grinding method produces fuel ethanol in the absolute majority, because the dry grinding method has less capital investment than the wet grinding method, and the wet grinding method is more often used to obtain corn starch, corn germ meal and other by-products. According to CARD, Iowa, a dry milling plant with the latest production process, has 2.8 gallons of corn ethanol + 17 pounds of DDGS + 0.7 pounds of corn oil per 1 pu corn + 72,800 Btu natural gas .
2.1, wet grinding method
The dry milling method is to crush the whole corn kernel and ferment it, while the wet grinding method is different, which first separates the corn kernels into multiple parts, and then produces a variety of food and industrial products, including corn starch, crystalline glucose, and fuel ethanol.
The wet grinding method first cleans the grain impurities, and then soaks the corn particles under specific temperature, time, and lactic acid conditions. After soaking, the corn germ is separated from the corn kernels, and after separation, it is washed with water, the purpose is to remove the starch and protein extract in the future, purify the corn germ, and extract corn oil from the purified corn germ. In addition to corn germ, the remaining substances can be separated into fiber, gluten, starch, and their final products are very rich, including corn germ meal, corn protein powder, corn protein feed, corn starch, fuel ethanol, corn fructose glucose syrup, which can be widely used in the food or feed industry.
4 U.S. Corn Ethanol and DDGS Market Analysis
4.1, the United States ethanol supply
Capacity and output
According to the EIA, as of January 1, 2021, there were a total of 197 fuel ethanol producers in the United States with a production capacity of 17.546 billion gallons, or about 1.145 million barrels per day. In terms of production capacity distribution, according to the division of oil management defense divisions, PADD2 concentrated 178 fuel ethanol producers, with a production capacity of 16.271 billion gallons, accounting for 92.7%; by state, Iowa occupies an absolute advantage, followed by Nebraska, Illinois, South Dakota, Minnesota, Indiana, etc., which are the most important corn-producing states in the United States; by enterprise division, the five enterprises with the largest fuel ethanol production capacity in the United States are Valero, ADM, and Poet Green Plains and Flint Hills, which together account for nearly 40 percent of the U.S. capacity.
U.S. fuel ethanol production in 2018 and 2019 was 16.1 billion gallons (an all-time high) and 15.78 billion gallons, respectively, and in 2020, production affected by the COVID-19 pandemic fell to 13.926 billion gallons. Capacity utilization remained at a high level overall.
The operation of ethanol enterprises
The vast majority of U.S. corn ethanol production capacity is located in the main corn-producing areas of the Midwest, which has excellent geographical advantages. U.S. corn is sown in April and harvested in mid-September, during which farmers and traders generally store the corn and sell it in subsequent batches. It is precisely because of this that usually ethanol production enterprises do not purchase and store corn raw materials in large quantities during the corn harvest season, but purchase raw materials on demand according to their respective warehouse capacity, capacity output, sales and judgment of the future market. For enterprises with only one factory, or where the factory is concentrated in one region, they prefer to establish long-term cooperative relations directly with local farmers to save logistics costs; for large-scale enterprises with factories all over the country, they usually cooperate with large traders to ensure the supply of raw materials and facilitate management.
After corn ethanol is produced, the plant either transports the ethanol directly to the oil refinery, where the refinery mixes the ethanol with gasoline and transports it to a gas station or sells it to the end customer; the factory can also transport it to a storage location designated by the partner trader, and the subsequent blending or sale is done by the trader.
import
In 2020, the United States imported 173 million gallons of ethanol, accounting for 1.4% of the US ethanol consumption that year. The highest ethanol imports were in 2012 and 2013, with imports of 555 million gallons and 400 million gallons, respectively, accounting for only 4.3% and 3% of consumption. 99% of ethanol in the United States is imported by California, of which the port of San Francisco accounts for about 70% of the imports and the port of Los Angeles accounts for about 30%. Almost all imported ethanol comes from Brazil, mainly due to the depreciation of the Brazilian currency and favorable price differentials between the two markets (the California Air Commission passed the Low Carbon Fuel Standard in 2009, the LCFS sets annual carbon intensity standards, and refiners or importers can obtain credits by selling fuels with less carbon intensity than the standard, or they can purchase carbon credits to fulfill their obligations).
4.2, the United States ethanol demand
Domestic consumption is the mainstay
The vast majority of fuel ethanol in the United States is consumed domestically, with consumption of 14.42 billion gallons, 14.55 billion gallons and 12.63 billion gallons in 2018-2020, respectively. The EIA shows that total gasoline sales in the United States in 2019 were 134 billion gallons (excluding the special circumstances of the COVID-19 epidemic in 2020), and the average fuel ethanol addition rate was 10.86%. Blending fuel ethanol into gasoline is not only more environmentally friendly, but also reduces U.S. oil imports.
Fuel ethanol is mainly added to gasoline for road transport, and the current common proportions of addition in the United States are E10, E15 and E85. As we mentioned in the policy section above, the Clean Air Act of 1978 allows the addition of 10% volume of ethanol (E10) to gasoline, and since 2010 the proportion of ethanol added to almost all gasoline sold in the United States has been limited to 10%. In June 2011, the EPA approved E15 gasoline for use in passenger cars, light trucks and mid-duty vehicles for the 2001 model year and newer models. The E15 debuted at a gas station in Kansas in 2012, and nearly 97 percent of registered vehicles on the road to date have been legally approved by the EPA to use the E15, with E15 sales being more common than the E85. From 2015 to 2020, the number of E15 gas stations nationwide increased from about 130 to more than 2,000 (about 1/3 is located in Minnesota and Iowa, with more than 100,000 gas stations in the United States). E85 can be used in flex-fuel vehicles (FFVs), FFVs use gasoline mixtures, ethanol addition can be any proportion of the 0-85% range. RFA estimates that there are currently more than 22 million FFVs on U.S. roads, or about 8 percent of all vehicles.
outlet
The United States is the world's largest exporter of ethanol. Ethanol exports in 2020 were 1.334 billion gallons, the fourth highest level in history, of which denatured fuel ethanol accounted for 50%, non-denatured fuel ethanol accounted for 43%, and a small number of other ethanol products. In recent years, the total amount of U.S. ethanol exports has increased year by year, but the proportion of exports accounting for 10.4% of total production in 2020, and the rest of the years will not exceed 10%. The U.S. ethanol export destination covers about 90 countries on six continents in the world, and in 2020, it will be Canada, Brazil, India, South Korea, the Netherlands, etc. in order of export volume. Two-thirds of ethanol is exported from the Gulf of Mexico, and the rest is shipped from the ports of the West Of the United States to the rest of the world.
In recent years, U.S. ethanol exports have shown obvious changes, and the proportion of emerging markets is gradually increasing in addition to traditional markets (Canada, Brazil, and the European Union). U.S. ethanol exports to Canada have remained stable for nearly a decade; taking 2018 as a turning point, exports to Brazil continued to increase significantly before 2018, falling significantly in 2019 and 2020; but exports to emerging markets, including India and South Korea, have increased steadily since 2015-2016. Oil prices, the dollar exchange rate, and national biofuel policies are the most important factors affecting U.S. exports.
4.3. Production profit, EPA policy and FACTORS price impact
Production profit
Unlike biodiesel, since 2011, with the exception of cellulosic ethanol producers, U.S. governments at all levels have stopped providing financial subsidies or tax credits to ethanol producers or blenders, and the vast majority of support is reflected in assisting in the replacement of old equipment or new infrastructure. As we mentioned in the corn pressing dry mill process above, each 1 corn + 72,800 Btu natural gas = 2.8 gallons of corn ethanol + 17 lbs of DDGS + 0.7 lbs of corn oil. As Shown in Figure 20, the vast majority of ethanol production costs come from corn, while natural gas and other operating costs remain at relatively fixed levels, and U.S. ethanol producers are mostly able to achieve positive operating profits (Return over operating costs). But if you consider the cost of capital, the operating profit of a corn ethanol plant in Iowa is greater than $0.25/gallon to achieve a real net profit.
The impact of EPA policy
Like biodiesel, ethanol production is largely affected by policy.
Background: RFS was created by the EPA under the Energy Policy Act and further expanded its implementation under the Energy Independence and Security Act. The goal of RFS is to use renewable fuels to replace or reduce the amount of oil transport fuel, heating oil, or aviation fuel used. The RFS divides renewable fuels into four categories, and since the EPA uses RINs (Renewable Identification Numbers) to monitor whether gasoline and diesel producers and importers are meeting their obligations, each biofuel is given a different D code in THE RINs:
(1) Biomass-based diesel, the main raw materials are soybean oil, palm oil, vegetable oil and other vegetable oils, waste oils and animal fats, D code is 4.
(2) Cellulosic biofuel (Cellulosic biofuel), the main raw materials are corn stalks, wood chips, miscanthus, biogas, D code is 3, if it is cellulosic diesel, D code is 7.
(3) Advanced biofuels (Advanced biofuel), the main raw materials are sugarcane, biobutyl alcohol, etc., and the D code is 5.
(4) All renewable fuels, including advanced biofuels and traditional renewable fuels; traditional renewable fuels usually refer to corn ethanol, the raw material is corn starch, and the D code is 6.
It is important to note that (1) and (2) are subsets of (3) and (3) are subsets of (4), which means that when gasoline and diesel producers and importers use RINs codes to prove that they have fulfilled their obligations, D3, D7 and D4 can also be used to prove the completion of advanced biofuel obligations, and D3, D4, D5 and D7 can also be used to prove the completion of (traditional) renewable fuel obligations.
Strictly speaking, FRS does not directly regulate the yield of corn ethanol. The Energy Independence and Safety Act of 2007 aims to produce 36 billion gallons of renewable fuels by 2022, of which advanced biofuels must account for a certain percentage, and also sets requirements for biomass diesel, cellulosic biofuels, advanced biofuels, and all renewable fuels for each year from 2009 to 2022. Assuming that the advanced biofuel production exactly meets the RFS requirements, the traditional biofuel (i.e., corn ethanol) production requirements are indirectly calculated by subtracting the "all renewable fuel production targets" from the "advanced biofuel production targets".
The Clean Air Act also authorizes the EPA to adjust the production of four types of renewable fuels annually. In general, the production standards for the current compliance year need to be determined by November 30 of the previous year, while the production standards for biomass diesel in the current year need to be determined at least 14 months in advance. As can be seen from Figure 22, in fact, except for biodiesel and corn ethanol, other categories of production have not met the targets of the Energy Independence and Security Act of 2007.
The rapid development of biodiesel and corn ethanol in the United States is inseparable from the support of policies. However, the frequent news of possible changes in renewable fuel policies in 2021 has increased the uncertainty about the future growth rate of BIODiesel and corn ethanol production in the United States. Previously, with the joint efforts of all parties, in June 2019, the EPA finally passed regulations allowing gasoline retailers to sell E15 uninterrupted throughout the year. But in early August, a judgment from the DC Circuit could overturn that year's EPA. If the Circuit's decision is finalized (E15 sales are not allowed in the summer), E15 sales will drop significantly, major fuel retailers may abandon investment in E15 gas stations, and hopes of achieving the goal of "replacing E10 as U.S. standard gasoline in this decade" become slim. At present, the EPA and biofuel manufacturers have filed complaints, and will continue to focus on tracking us policy changes in the future.
RINs price formation mechanism
As we mentioned above, each year the EPA divides the total production of each renewable fuel program by the estimated sales of gasoline and diesel for the current year to determine the approximate annual percentage standard. This percentage is multiplied by the actual sales volume of gasoline and diesel by the obligor (refinery, importer) to determine the RVO (Renewable Volume Obligation) of each enterprise. EPA tracks whether companies have fulfilled their renewable fuel obligations through RINs.
As shown in Figure 23, the production of corn ethanol (renewable fuel) is accompanied by the production of RINs (Attached RINs), which will accompany corn ethanol for life. If corn ethanol is used for export, the corresponding RINs are disposed of. If corn ethanol is sold to a blender, RINs are also transferred to the blender; rins are not separated from corn ethanol until they are sold or exported after being mixed with gasoline. The separated RINs have specialized trading markets with corresponding prices. Ethanol producers, gasoline and diesel refineries and importers, as well as other related operating entities are required to submit all information reports on the production, transfer, trading, etc. of RINs to the EPA, and can also participate in the trading activities of riNs after separation. The obligated party can obtain RINs by blending ethanol into gasoline, or by purchasing isolated RINs on the market, thereby proving to the EPA that the obligation has been fulfilled, and the EPA guarantees that ethanol is actually added to the gasoline through THERINs.
For ethanol producers, when ethanol demand is greater than production, ethanol prices rise and production profits improve, stimulating companies to increase ethanol production; vice versa. However, since the blending of ethanol into gasoline is more of a policy demand (not a market demand), a system of RINs is needed to ensure that EPA meets the renewable fuel use target, and the RINs price regulates the blending profit and the supply of Separated RINs in the market. Below we will analyze the price formation mechanism of the US RINs market, and the price of RIN-D6 is mainly affected by the following factors:
(1) The greater the blending loss, that is, the greater the (corn ethanol price - gasoline price), the higher the RIN-D6 price.
Since the RFS obligor accounts for more than 90% of the refinery RVO, and the refinery consumes most of the RINs, but only accounts for about 15% of the blending capacity, the completion of its RINs should mainly rely on the purchase from the blender. The reason why the EPA levies RINs from refiners instead of blenders is that the dopants are weak, and the collection of RINs from refiners allows blenders to pass on costs to refineries (refiners may have cracking profits). In other words, RIN-D6 is a market subsidy given to blenders when the mixing is not profitable, and RIN-D6 should rise to the point where it can stimulate companies to increase the amount of corn ethanol blended in gasoline until the policy requirements are met.
The demand curve for corn ethanol in the United States is thought to be "H" shaped: First, at about 5 billion gallons, the demand curve is a vertical line, and the price elasticity of demand is almost zero. Because most U.S. states banned MTBE between 2000 and 2007, fuel ethanol became the only most economical gasoline additive. Secondly, under market-oriented conditions, in the range of 5 billion to about 13 billion (10% of gasoline sales), the demand curve is about a horizontal line, and the price elasticity of corn ethanol demand is infinite. This is because corn ethanol and gasoline can almost be considered complete substitutes, and since the size of the corn ethanol market is insignificant compared to the gasoline market, once the price of corn ethanol is greater than the price of gasoline, the blender has no incentive to blend ethanol into gasoline. However, due to the "mandatory" blending of renewable fuels in the United States, if the amount of ethanol blended in gasoline is insufficient, it means that the number of Separated RINs in Figure 23 is reduced, and the number of RINs is not enough to meet the RVO specified by the EPA, which requires an increase in the price of RIN-D6 to stimulate companies to blend ethanol in gasoline. Conversely, on top of ethanol production exceeding EPA requirements, the price of RIN-D6 should be close to zero if blending ethanol into gasoline is still economical. Third, at greater than 13 billion gallons, the demand curve for corn ethanol is once again a vertical line. This is because although the EPA approved E15 gasoline for passenger cars, light trucks and medium-sized vehicles of the 2001 model and newer models in June 2011, most automakers will not fulfill the warranty if the owner uses gasoline mixed with more than 10% ethanol, which greatly limits the further increase in ethanol demand, also known as the "E10 blend wall".
(2) The impact of RIN-D4 price. Generally 1 gallon of corn ethanol can obtain 1 RIN (EV = 1), other renewable fuels specify ethanol equivalent (see Figure 24 for details), biodiesel EV value is 1.5, so the production of 1 gallon of biodiesel can obtain 1.5 RIN. RFA divides renewable fuels into four categories, and since biodiesel (D4) is a subset of advanced biofuels, which in turn is a subset of all renewable fuels (D6), D4 can also be used to prove the fulfillment of D6 obligations, so theoretically the price of RIN-D6 should not be higher than that of RIN-D4.
In turn, the RIN-D6 price will also have an impact on the RIN-D4 price. From the perspective of corn ethanol demand curve, if the EThanol production requirements formulated by the RFS are greater than 10% of the US gasoline sales, due to the existence of "E10 blend wall", then the difference between the two has actually become the production requirements of advanced biofuels to some extent, considering the small production scale of cellulosic biofuels, in fact, it has become the production requirements of biofuels.
(3) Policy implications. According to Chart 22, the corn ethanol production standard calculated for many consecutive years is 15 billion gallons, both according to the Energy Independence and Safety Act and the actual yield standard published by the EPA. However, if the use of renewable fuel standards published by the EPA increases significantly in a given year, RIN-D6 is bound to rise accordingly, similar to the impact of biodiesel production policies on the price of RIN-D4. If EPA increases SREs (Small Refinery Exemptions), the market may expect an increase in potential supply of RINs, and the RIN-D6 price will fall as a result. The 2021 RVO has not yet been announced, and the market expects that the renewable fuel production standard may still be raised under the general trend of clean energy development in the United States, making the price of RINs high.
(4) Time value. RINs are valid for 2 years, generally speaking, 80% of the RVO of the enterprise in the current year needs to be met by the RINs generated in the current year, and if there are excess RINs, they can be postponed to the next two years, giving the RINs a certain time value.
4.4. Analysis of the US DDGS market
In recent years, the annual output of corn in the United States is about 360 million tons, about 35% of which is used for processing and production of fuel ethanol, of which more than 90% uses dry grinding. According to the USDA, in addition to ethanol and corn oil, the products that can be obtained by dry milling processing corn include concentrated distillate (CDS-syrup), dry distiller's lees (DDG), dry distiller's lees containing soluble substances (DDGS), lees wet grain (DWG) - ≥ 65% moisture content, modified wet distiller's grain (DWG) -40% to 64% moisture content. In fact, all of these by-products can be used in hogs, poultry, cattle and sheep, aquatic diets, and are a good source of animal feed; with the development of corn fuel ethanol in the United States, the production of by-products has also increased dramatically.
The total output of more than five ethanol production by-products in the United States reached a maximum of 51.6 million tons in 2018, compared with 48.9 million tons in 2019; in 2020, due to the impact of the new crown pneumonia epidemic, the demand and output of ethanol in the United States have dropped significantly, and the output of by-products has also dropped to 48.05 million tons. If broken down, DDGS and DWG-≥ the largest share of 65% moisture content production, with 2016 million tons and 12.39 million tons in 2020, respectively. The import volume of ethanol by-products is negligible and basically negligible.
Most of the by-products are consumed domestically as feed, and about 11 million tons of them are exported. In 2020, the main export destinations are Mexico, Vietnam, South Korea, Thailand, Indonesia and so on. China has also imported a large number of DDGS from the United States, with a total of 5.82 million tons in 2015. But with China's double reversal of the US DDGS, annual imports fell to just over 100,000 tons, but the US soon found a new export market.
5 corn ethanol and corn
5.1, the supply and demand pattern of U.S. corn
The United States is the world's largest producer and exporter of corn: total maize production in 20/21 exceeded 360 million tonnes, accounting for 32.3% of global production; exports of 70.49 million tonnes, accounting for 39.5% of global exports.
The law of change in corn planting area in the United States is consistent with that of American beans. Since the total planting area of corn, soybeans and wheat fluctuated in the range of 210-230 million acres for many years, and the planting areas of U.S. beans and U.S. corn overlapped highly, the planting proceeds and the soybean/corn price ratio determined how the area was distributed between soybeans and corn. In the past decade, the highest U.S. corn harvest area is 97.4 million acres, the lowest is 88.9 million acres, and the average is 92.1 million acres. The increase in yields is the most critical reason for the increase in total corn production in the United States. The continuous optimization of corn planting technology, irrigation water conservancy system and corn varieties in the United States has led to a twice-fold increase in yields over the past 60 years, and in recent years, yields have remained at a high level of 160-170 pu/acre.
At present, in the consumption of corn in the United States, feed consumption accounts for about 40% of production, the amount of corn used to produce ethanol accounts for about 35%, and exports account for about 15%. As can be seen from Charts 35 and 36, U.S. corn feed consumption has been stable for many years, and corn ethanol production provides additional demand increases.
5.2. The impact of ethanol production on the demand for corn in the United States
The general trend of the United States encouraging renewable fuels has not changed. The USDA, for example, said it has invested $66.4 million so far in biofuel projects that are expected to increase biofuel sales by 1.2 billion gallons a year. In August, the USDA also said it would invest $26 million in renewable fuel infrastructure, including E15 and E85. However, from the perspective of the production standards set by the EPA, it seems that the focus of the policy is still to ensure the production of advanced biofuels such as biodiesel. As we mentioned above, a decision by the DC Circuit in early August 2021 may prevent gasoline retailers from selling E15 uninterrupted throughout the year, so whether the demand for corn in U.S. ethanol production can continue to increase in the future will largely depend on policy.
Following the DC Circuit decision, RFA expects E15 sales to be roughly flat in 2022-2024 at 2021, with the non-permitted E15 full-year sales expected to reduce total E15 sales by 12.6 billion gallons in 2021-2024 compared to allowing full-year E15 sales, corresponding to a 630-000-gallon decline in ethanol sales and a 221 million-2024 decline in corn demand.
In the case that the demand for corn in the United States may not see a significant increase in the next 3-5 years, because the feed consumption of corn in the United States is relatively stable, the main factors that determine the future balance of corn supply and demand in the United States fall on the area, yield, and export. In 20/21, due to China's increased imports and the inventory-to-consumption ratio of U.S. beans and U.S. corn reaching a historic low, the CBOT agricultural products market ushered in a once-in-a-decade bull market. However, with the recovery of production and ending inventories in 21/22 (absolute levels are still low), CBOT corn highs have fallen back, and the probability of maintaining weak shocks in the following US harvest season is greater.
This article originated from the Orient Derivatives Research Institute