前言
前面一章,我们讲解了如何整合。而在实际情况下,使用了Hystrix
的同时,还会对其进行实时的数据监控,反馈各类指标数据。今天我们就将讲解下Hystrix
和Hystrix Dashboard
.其中Turbine
是一款针对Hystrix Dashboard
进行实时监控的工具,通过Hystrix
我们可以在直观地看到各Hystrix Dashboard
的请求响应时间, 请求成功率等数据,监控单个实例内的指标情况。后者Hystrix Command
,能够将多个实例指标数据进行聚合的工具。Turbine
Hystrix-Dashboard
是一款针对Hystrix进行实时监控的工具,通过Hystrix-dashboard(仪表盘)
Hystrix Dashboard
的请求响应时间, 请求成功率等数据。Hystrix Command
创建一个
spring-cloud-hystrix-dashboard
工程。
0.引入POM依赖。
<dependency>
<groupId>org.springframework.cloud</groupId>
<artifactId>spring-cloud-starter-netflix-hystrix-dashboard</artifactId>
</dependency>
1.启动类加入
@EnableHystrixDashboard
注解,开启仪表盘功能。
@SpringBootApplication
@EnableHystrixDashboard
@Slf4j
public class HystrixDashboardApplication {

public static void main(String[] args) {
SpringApplication.run(HystrixDashboardApplication.class, args);
log.info("spring-cloud-hystrix-dashboard启动!");
    }
}
2.配置文件修改下,指定端口和应用名称。
#应用名称
spring.application.name=hystrix-dashboard

#端口号
server.port=9696
3.启动应用,访问:http://127.0.0.1:9696/hystrix ,就可以看见如下页面了:
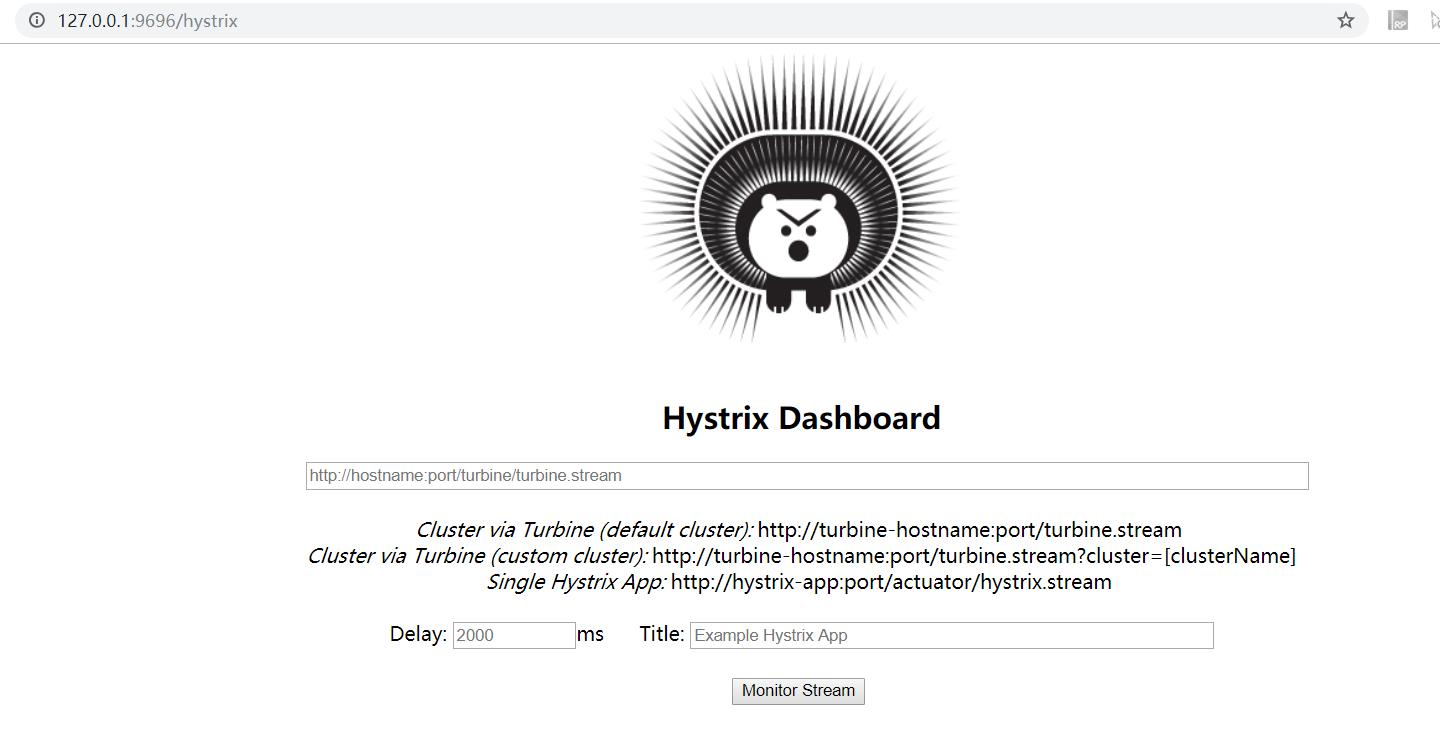
从首页的监控页面可以看出,此时尚未配置监控应用。而且,从页面我们也可以看出,一共有三种数据源形式,即不同的监控方式:
- 默认的集群监控:通过URL:http://turbine-hostname:port/turbine.stream 开启,实现对默认集群的监控。
- 指定的集群监控:通过URL:http://turbine-hostname:port/turbine.stream?cluster=[clusterName] 开启,实现对clusterName集群的监控。
- 单体应用的监控:通过URL:http://hystrix-app:port/actuator/hystrix.stream 开启,实现对具体某个服务实例的监控。
注意:
2.0
之后,默认的监控端点地址加了上下文路径
actuator
。可通过
management.endpoints.web.base-path
属性进行修改,默认是:
actuator
现在,我们改造下
spring-cloud-hystrix
项目,开启端点,同时启用监控端点
hystrix.stream
。 0.引入端点依赖。
<dependency>
<groupId>org.springframework.boot</groupId>
<artifactId>spring-boot-starter-actuator</artifactId>
</dependency>
1.配置文件开启端点
hystrix.stream
。这里需要注意,
2.0
之后,默认只开启了端点
info
、
health
。其他的需要通过
management.endpoints.web.exposure.include
进行额外配置。
#开启监控端点
management.endpoints.web.exposure.include=hystrix.stream
现在我们启动
spring-cloud-hystrix
。然后添加:http://127.0.0.1:8038/actuator/hystrix.stream 到仪表盘中。

填写了标题后,点击按钮
Monitor Stream
,就可以进入监控页面了。
此时,我们访问下:http://192.168.2.108:8038/feign 。因为服务
spring-cloud-eureka-client
未启动,所以会触发熔断方法,多访问几次,再次查看监控页面,就可以看见相关数据了。
此时,可以启动下服务
spring-cloud-eureka-client
,然后再次访问下接口。
不同的颜色对应断路器监控的百分比
- 实心圆:它有颜色和大小之分,分别代表实例的监控程度和流量大小。如上图所示,它的健康度从绿色、黄色、橙色、红色递减。通过该实心圆的展示,我们就可以在大量的实例中快速的发现故障实例和高压力实例。
- 曲线:用来记录 2 分钟内流量的相对变化,我们可以通过它来观察到流量的上升和下降趋势。
- 其他一些数量指标如下图所示
白话SpringCloud | 第六章:Hystrix监控面板及数据聚合(Turbine)
Turbine
hystrix
只能实现单个微服务的监控,可是一般项目中是微服务是以集群的形式搭建,一个一个的监控不现实。而
Turbine
的原理是,建立一个
turbine
服务,并注册到
eureka
中,并发现
eureka
上的
hystrix
服务。通过配置
turbine
会自动收集所需
hystrix
的监控信息,最后通过
dashboard
展现,以达到集群监控的效果。
简单来说,就是通过注册到注册中心,发现其他服务的
hystrix
服务,然后进行聚合数据,最后通过自身的端点输出到仪表盘上进行个性化展示。这我们就监控一个
turbine
应用即可,当有新增的应用加入时,我们只需要配置下
turbine
参数即可。
创建
spring-cloud-hystrix-turbine
工程。 0.引入POM依赖。
<!-- turbine依赖 -->
<dependency>
<groupId>org.springframework.cloud</groupId>
<artifactId>spring-cloud-starter-netflix-turbine</artifactId>
</dependency>
<!-- eureka client依赖 -->
<dependency>
<groupId>org.springframework.cloud</groupId>
<artifactId>spring-cloud-starter-netflix-eureka-client</artifactId>
</dependency>
1.启动类加入注解
@EnableTurbine
@EnableDiscoveryClient
.
/**
* turbine服务示例
* @author oKong
*
*/
@SpringBootApplication
@EnableTurbine
@EnableDiscoveryClient
@Slf4j
public class HystrixTurbineApplication {

public static void main(String[] args) {
SpringApplication.run(HystrixTurbineApplication.class, args);
log.info("spring-cloud-hystrix-turbine启动!");
    }
}
2.配置文件加入注册中心及
turbine
相关配置信息。
#应用名称
spring.application.name=hystrix-tuibine

#端口号
server.port=9698

#指定注册中心地址
eureka.client.service-url.defaultZone=http://127.0.0.1:1000/eureka
# 启用ip配置 这样在注册中心列表中看见的是以ip+端口呈现的
eureka.instance.prefer-ip-address=true
# 实例名称  最后呈现地址:ip:2000
eureka.instance.instance-id=${spring.cloud.client.ip-address}:${server.port}

#turbine配置
# 需要监控的应用名称,默认逗号隔开,内部使用Stringutils.commaDelimitedListToStringArray分割
turbine.app-config=hystrix-example
# 集群名称
turbine.cluster-name-expression="default"
# true 同一主机上的服务通过host和port的组合来进行区分,默认为true
# false 时 在本机测试时 监控中host集群数会为1了 因为本地host是一样的
turbine.combine-host-port=true
2.修改
spring-cloud-hystrix
应用,创建一个
application-turbine.properties
配置文件,里面就设置一个端口好区别下实例。
application-turbine.properties
server.port=8039
2.此时启动下应用,同时启动
spring-cloud-hystrix
应用,设置不同的
spring.profiles.active
值,以此启动多个实例。在仪表盘应用:http://127.0.0.1:9696/hystrix 中添加:http://127.0.0.1:9698/turbine.stream ,之后点击按钮:
Monitor Stream
,此时界面是
loading
状态。接着多次访问:http://127.0.0.1:8038/feign?name=oKong ,并可以看见有数据了。
之后,我们接着访问:http://127.0.0.1:8039/feign?name=oKong ,可以看见
Hosts
变成2了。
一点疑问:关于
hystrix dashboard
是监控
Hystrix Command
的指标情况,当我们监控的方法都一致时,是不是区分不了具体是哪个服务的了?按目前的演示demo中,是没有看出具体是哪个应用出现了异常。。不知道是不是使用姿势不对,觉得不应该是这样的吧。。
加了个配置文件
applicatioon-test
,端口号不一致,创建个新的api接口加上
HystrixCommand
,最后出现的图例确实是按照方法名来的。这应该不是巧合了吧。。
还希望有了解这方面的同学,能答疑解惑下。目前是用
pinpoint
了,对这块不是很熟悉。而且
pinpoint
也仅仅是监控了下,具体深入尚未了解。。路漫漫其修远兮呀!
参考资料
- https://cloud.spring.io/spring-cloud-static/Finchley.SR1/single/spring-cloud.html#_hystrix_timeouts_and_ribbon_clients