前言
前面一章,我們講解了如何整合。而在實際情況下,使用了Hystrix
的同時,還會對其進行實時的資料監控,回報各類名額資料。今天我們就将講解下Hystrix
和Hystrix Dashboard
.其中Turbine
是一款針對Hystrix Dashboard
進行實時監控的工具,通過Hystrix
我們可以在直覺地看到各Hystrix Dashboard
的請求響應時間, 請求成功率等資料,監控單個執行個體内的名額情況。後者Hystrix Command
,能夠将多個執行個體名額資料進行聚合的工具。Turbine
Hystrix-Dashboard
是一款針對Hystrix進行實時監控的工具,通過Hystrix-dashboard(儀表盤)
Hystrix Dashboard
的請求響應時間, 請求成功率等資料。Hystrix Command
建立一個
spring-cloud-hystrix-dashboard
工程。
0.引入POM依賴。
<dependency>
<groupId>org.springframework.cloud</groupId>
<artifactId>spring-cloud-starter-netflix-hystrix-dashboard</artifactId>
</dependency>
1.啟動類加入
@EnableHystrixDashboard
注解,開啟儀表盤功能。
@SpringBootApplication
@EnableHystrixDashboard
@Slf4j
public class HystrixDashboardApplication {

public static void main(String[] args) {
SpringApplication.run(HystrixDashboardApplication.class, args);
log.info("spring-cloud-hystrix-dashboard啟動!");
    }
}
2.配置檔案修改下,指定端口和應用名稱。
#應用名稱
spring.application.name=hystrix-dashboard

#端口号
server.port=9696
3.啟動應用,通路:http://127.0.0.1:9696/hystrix ,就可以看見如下頁面了:
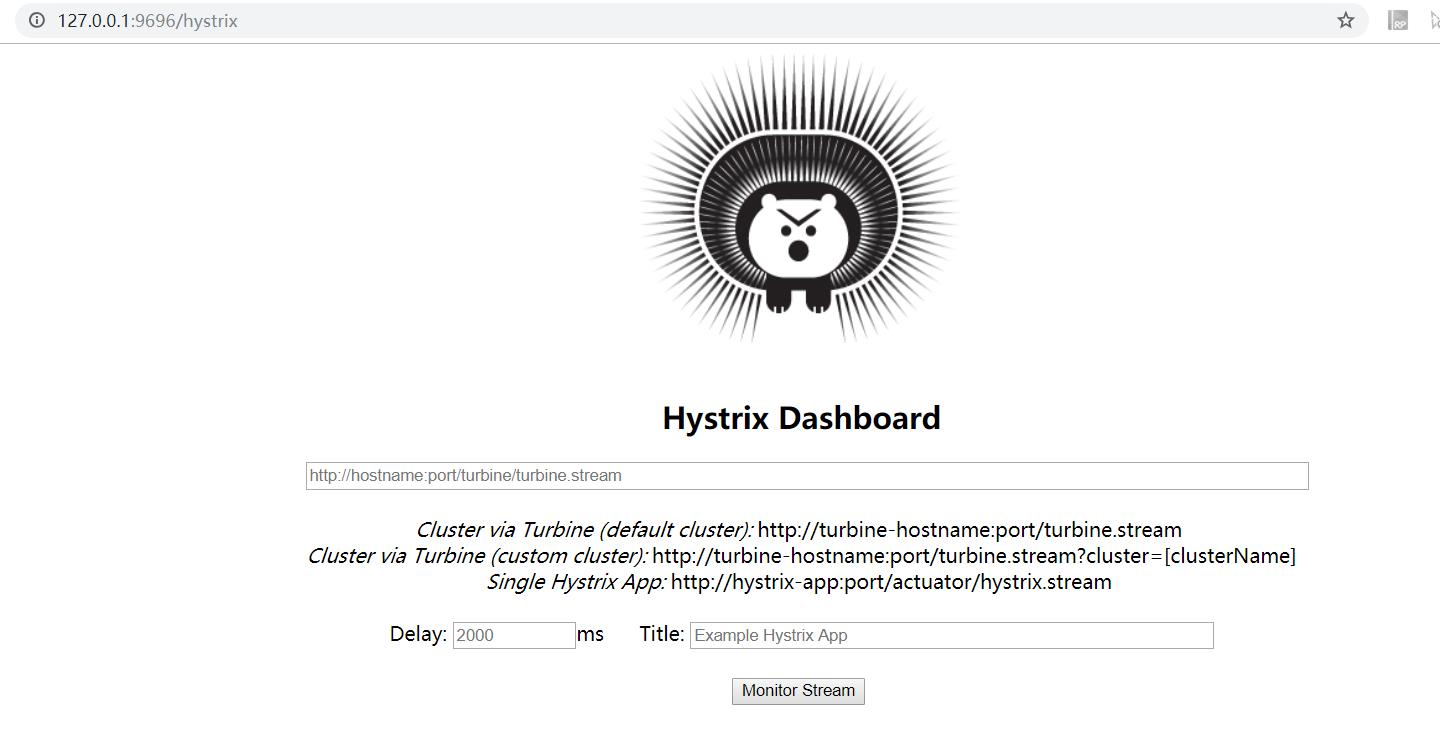
從首頁的監控頁面可以看出,此時尚未配置監控應用。而且,從頁面我們也可以看出,一共有三種資料源形式,即不同的監控方式:
- 預設的叢集監控:通過URL:http://turbine-hostname:port/turbine.stream 開啟,實作對預設叢集的監控。
- 指定的叢集監控:通過URL:http://turbine-hostname:port/turbine.stream?cluster=[clusterName] 開啟,實作對clusterName叢集的監控。
- 單體應用的監控:通過URL:http://hystrix-app:port/actuator/hystrix.stream 開啟,實作對具體某個服務執行個體的監控。
注意:
2.0
之後,預設的監控端點位址加了上下文路徑
actuator
。可通過
management.endpoints.web.base-path
屬性進行修改,預設是:
actuator
現在,我們改造下
spring-cloud-hystrix
項目,開啟端點,同時啟用監控端點
hystrix.stream
。 0.引入端點依賴。
<dependency>
<groupId>org.springframework.boot</groupId>
<artifactId>spring-boot-starter-actuator</artifactId>
</dependency>
1.配置檔案開啟端點
hystrix.stream
。這裡需要注意,
2.0
之後,預設隻開啟了端點
info
、
health
。其他的需要通過
management.endpoints.web.exposure.include
進行額外配置。
#開啟監控端點
management.endpoints.web.exposure.include=hystrix.stream
現在我們啟動
spring-cloud-hystrix
。然後添加:http://127.0.0.1:8038/actuator/hystrix.stream 到儀表盤中。

填寫了标題後,點選按鈕
Monitor Stream
,就可以進入監控頁面了。
此時,我們通路下:http://192.168.2.108:8038/feign 。因為服務
spring-cloud-eureka-client
未啟動,是以會觸發熔斷方法,多通路幾次,再次檢視監控頁面,就可以看見相關資料了。
此時,可以啟動下服務
spring-cloud-eureka-client
,然後再次通路下接口。
不同的顔色對應斷路器監控的百分比
- 實心圓:它有顔色和大小之分,分别代表執行個體的監控程度和流量大小。如上圖所示,它的健康度從綠色、黃色、橙色、紅色遞減。通過該實心圓的展示,我們就可以在大量的執行個體中快速的發現故障執行個體和高壓力執行個體。
- 曲線:用來記錄 2 分鐘内流量的相對變化,我們可以通過它來觀察到流量的上升和下降趨勢。
- 其他一些數量名額如下圖所示
白話SpringCloud | 第六章:Hystrix監控面闆及資料聚合(Turbine)
Turbine
hystrix
隻能實作單個微服務的監控,可是一般項目中是微服務是以叢集的形式搭建,一個一個的監控不現實。而
Turbine
的原理是,建立一個
turbine
服務,并注冊到
eureka
中,并發現
eureka
上的
hystrix
服務。通過配置
turbine
會自動收集所需
hystrix
的監控資訊,最後通過
dashboard
展現,以達到叢集監控的效果。
簡單來說,就是通過注冊到注冊中心,發現其他服務的
hystrix
服務,然後進行聚合資料,最後通過自身的端點輸出到儀表盤上進行個性化展示。這我們就監控一個
turbine
應用即可,當有新增的應用加入時,我們隻需要配置下
turbine
參數即可。
建立
spring-cloud-hystrix-turbine
工程。 0.引入POM依賴。
<!-- turbine依賴 -->
<dependency>
<groupId>org.springframework.cloud</groupId>
<artifactId>spring-cloud-starter-netflix-turbine</artifactId>
</dependency>
<!-- eureka client依賴 -->
<dependency>
<groupId>org.springframework.cloud</groupId>
<artifactId>spring-cloud-starter-netflix-eureka-client</artifactId>
</dependency>
1.啟動類加入注解
@EnableTurbine
@EnableDiscoveryClient
.
/**
* turbine服務示例
* @author oKong
*
*/
@SpringBootApplication
@EnableTurbine
@EnableDiscoveryClient
@Slf4j
public class HystrixTurbineApplication {

public static void main(String[] args) {
SpringApplication.run(HystrixTurbineApplication.class, args);
log.info("spring-cloud-hystrix-turbine啟動!");
    }
}
2.配置檔案加入注冊中心及
turbine
相關配置資訊。
#應用名稱
spring.application.name=hystrix-tuibine

#端口号
server.port=9698

#指定注冊中心位址
eureka.client.service-url.defaultZone=http://127.0.0.1:1000/eureka
# 啟用ip配置 這樣在注冊中心清單中看見的是以ip+端口呈現的
eureka.instance.prefer-ip-address=true
# 執行個體名稱  最後呈現位址:ip:2000
eureka.instance.instance-id=${spring.cloud.client.ip-address}:${server.port}

#turbine配置
# 需要監控的應用名稱,預設逗号隔開,内部使用Stringutils.commaDelimitedListToStringArray分割
turbine.app-config=hystrix-example
# 叢集名稱
turbine.cluster-name-expression="default"
# true 同一主機上的服務通過host和port的組合來進行區分,預設為true
# false 時 在本機測試時 監控中host叢集數會為1了 因為本地host是一樣的
turbine.combine-host-port=true
2.修改
spring-cloud-hystrix
應用,建立一個
application-turbine.properties
配置檔案,裡面就設定一個端口好差別下執行個體。
application-turbine.properties
server.port=8039
2.此時啟動下應用,同時啟動
spring-cloud-hystrix
應用,設定不同的
spring.profiles.active
值,以此啟動多個執行個體。在儀表盤應用:http://127.0.0.1:9696/hystrix 中添加:http://127.0.0.1:9698/turbine.stream ,之後點選按鈕:
Monitor Stream
,此時界面是
loading
狀态。接着多次通路:http://127.0.0.1:8038/feign?name=oKong ,并可以看見有資料了。
之後,我們接着通路:http://127.0.0.1:8039/feign?name=oKong ,可以看見
Hosts
變成2了。
一點疑問:關于
hystrix dashboard
是監控
Hystrix Command
的名額情況,當我們監控的方法都一緻時,是不是區分不了具體是哪個服務的了?按目前的示範demo中,是沒有看出具體是哪個應用出現了異常。。不知道是不是使用姿勢不對,覺得不應該是這樣的吧。。
加了個配置檔案
applicatioon-test
,端口号不一緻,建立個新的api接口加上
HystrixCommand
,最後出現的圖例确實是按照方法名來的。這應該不是巧合了吧。。
還希望有了解這方面的同學,能答疑解惑下。目前是用
pinpoint
了,對這塊不是很熟悉。而且
pinpoint
也僅僅是監控了下,具體深入尚未了解。。路漫漫其修遠兮呀!
參考資料
- https://cloud.spring.io/spring-cloud-static/Finchley.SR1/single/spring-cloud.html#_hystrix_timeouts_and_ribbon_clients