1. 前言
看园子里面讲
dotTrace
的文章不多,最近也有这方面的需要,于是去搜索了一下,.NET 性能分析方面的工具。目的呢,主要是想发现我的代码中,哪些代码占用了最多时间,来进行优化。主要有两个工具,一个是
Visual-Studio 2017
自带的
Performance Profiler
还有一个就是
DotTrace
。
两者大概长成如下这样:首先是
Performance Profiler
Performance Profiler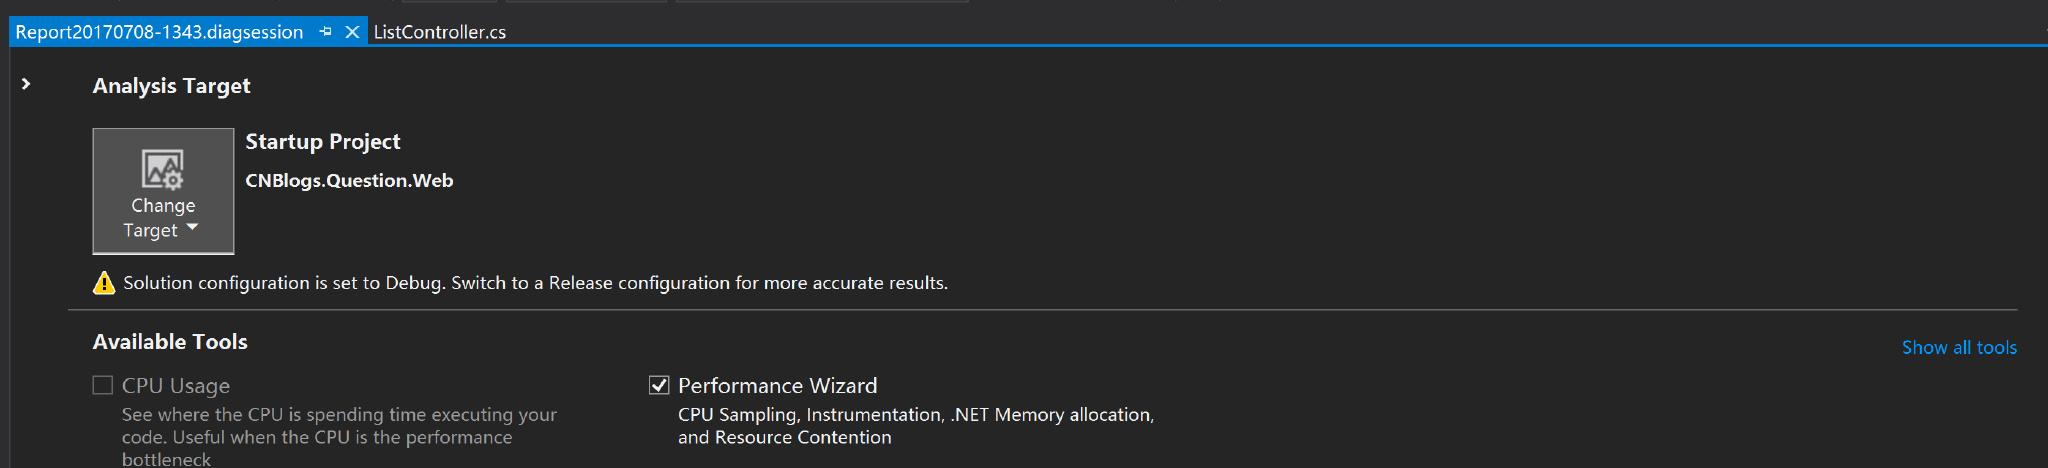
用DotTrace 来分析.NET-Core程序
以及
DotTrace
DotTrace
用DotTrace 来分析.NET-Core程序
Visual Studio
的那个用不怎么来,接下来就介绍一下
DotTrace
的基本使用分析。
2. DotTrace 基本介绍
dotTrace is arguably the most convenient tool for .NET performance profiling.
dotTrace lets you find performance bottlenecks in a variety of .NET applications, including applications based on .NET Framework up to the version 4.6 and Silverlight 5.
看到官网上这么吹一波,感觉你可以去试试它到底怎么样,帮你找到性能瓶颈。。。
3. 具体使用
我们的目的很明确, 想知道一个功能它里面最占用时间的是哪个具体的方法。
其实他的作用很多,但我们这次只使用一小点。
操作步骤:
3.1 选择你所要分析的具体.NET-Core 程序
在下图右侧的
Application
中,选择你
Web
的
XXX.dll
,然后点击
Run
就开始了
用DotTrace 来分析.NET-Core程序
3.2 根据控制台上的地址打开网址
启动时就会出现下面的这样一个控制台。
用DotTrace 来分析.NET-Core程序
3.3 在网页上操作你所要测试的方法。
用DotTrace 来分析.NET-Core程序
现在
Get Snapshot and Wait
是灰色的,因为我已经操作完成了,当你操作完成后,点击
Get Snapshot and Wait
然后就会生成一个分析报告了。
报告长得就是如下样子:
想要看到具体哪个方法调用了最多时间,点击左侧第四个
Hot Spots
,然后就可以看到我上面的图了,右侧还可以显示,IL 解析前后的代码。非常方便。
上面那幅图官方的一个解释可供参考:
参考链接
- https://www.jetbrains.com/help/profiler/Get_Started_with_Performance_Viewer.html