1 Article Introduction
China is a big country in marine aquaculture, contributing more than 60% of the marine aquaculture products to the world, more than all other countries in the world combined, and many coastal areas rely on mariculture to achieve rapid development.
However, with the increase in people's demand for seafood, the rapid development of the marine aquaculture industry has also brought some problems to the ecological environment of coastal zone areas.
The spatial distribution information of aquaculture data can provide scientific data support for regional overall management, marine disaster prevention and mitigation, ecological environment monitoring, resource development and sustainable social and economic development.
However, the current data is missing, which seriously hinders the development of research in related fields.
2 Research methodology
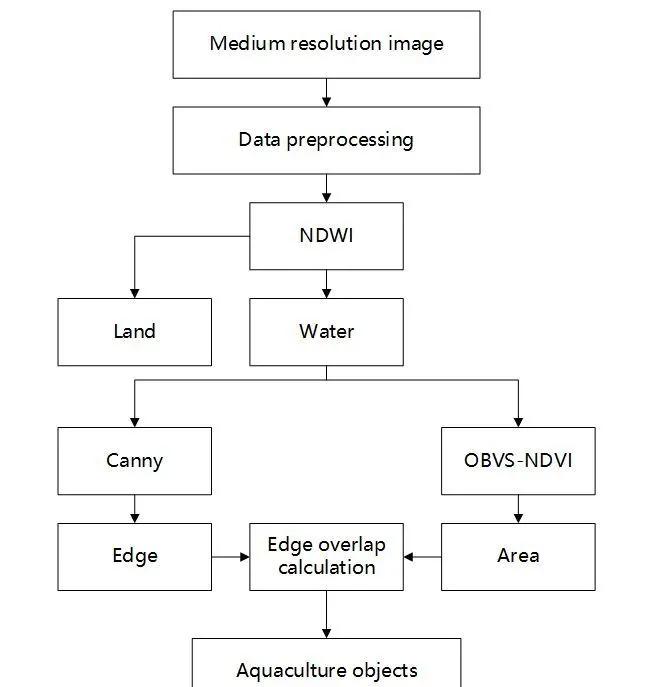
The whole research process is shown in the following figure, after the remote sensing image is pre-processed by data, the water body index ndwi is used for land and water separation operations, and then the canopy operator and the obvs-ndvi method are used to extract the edge characteristics and potential breeding plaques in the water body, and the edge coincidence degree is used to calculate the superimposed edge characteristics and potential breeding spots, and the final breeding goal is obtained.
Raft culture is the main culture method of algae culture, and the spectral characteristics of algae at maturity have certain similarities with plants, so the vegetation index (ndvi) can be used to detect potential raft culture plaques. Due to the complexity of the water color, the natural algae in the seawater will interfere with the detection, but the general culture patch has a higher ndvi value than the surrounding seawater, so the obvs-ndvi is used to calculate the difference characteristics between the culture patch and the surrounding patch to obtain the potential breeding target.
obvs-ndvi:

where nir is the average spectral value of the object-oriented segmented plaque in the near-infrared band, r is the average spectral value of the plaque in the red light band; o represents the plaque currently being calculated, n(o) represents the patch set adjacent to plaque o, b (o, oj) represents the common side adjacent to plaque o adjacent to plaque oj, mo(ndvi) represents the ndvi value of plaque o, and soj represents the ndvi difference characteristic of plaque o and adjacent plaque set n(o).
Edge stacking determines the goal of the breeding area: the edge characteristics are superimposed with the potential culture patches to achieve high-precision extraction of the spots in the breeding area.
After the canny operator calculates the edge feature, the edge probability graph eg(x,y) is obtained by using Gaussian filtering. The edge overlap rj is then calculated.
where bj is the edge pixel set of potentially farmed plaque soj, | the number of pixels contained in the pixel set | bj. According to Wang Jun's research, the extraction accuracy is the highest when the rj is 0.15-0.25. Therefore, this study sets the rj according to the same range.
3 Analysis of results
According to the extraction results, the area of raft culture offshore China in 2018 was 194,110 ha. The overall distribution of raft culture shows the characteristics of "more north and less south", and the raft culture area in Jiangsu Province is the largest (55,851 ha; Accounted for 28.8 %), followed by Fujian Province (39,637 hectares; 20.4%), Shandong Province (25,457 hectares; Accounted for 13.1 %), Hebei Province (23,904 hectares; Accounted for 12.3 %), Liaoning Province (19,953 hectares; 10.3%), Guangdong Province (17,558 hectares; Accounted for 9.0 %) and Zhejiang Province (10,049 hectares; 5.2 %). Raft culture in Guangxi Province is the smallest (1701 ha; Accounting for 0.9%), raft culture has not been observed in Hainan Province.
In 2018, the area of cage culture offshore China was 5,784.780 ha. Contrary to the distribution characteristics of raft culture, the overall distribution of cage culture shows the characteristics of "more south and less north". The largest area of cage culture in Fujian Province (3,749.100 ha; Accounted for 64.8 %), followed by Guangdong Province (1,009.634 hectares; Accounted for 17.45 %). In fact, the area of cage culture in these two provinces has exceeded 80% of the national cage culture area. Followed by Liaoning Province (325.439 hectares; Accounted for 5.63 %), Shandong Province (261.139 hectares; Accounted for 4.51 %), Hainan Province (200.882 hectares; 3.47 %), Guangxi Province (149.530 hectares; Accounted for 2.58 %) and Zhejiang Province (89.056 ha; 1.54 %). Cage culture has not been found in Hebei and Jiangsu provinces.
According to the distribution of extracted aquaculture areas, it can be observed that China's offshore aquaculture is mainly distributed in the sea area within 40 km of the coastline, and some marine aquaculture areas also exist around some islands far from the shoreline. Offshore aquaculture areas are mainly distributed in estuaries, inner bays and near islands.
(a) Raft culture area distribution (ha) (b) cage culture area distribution (ha)
In southern China, most of the culture areas are distributed in the inner bay or the mouth of the bay, while in north-central China, such as Liaoning Province and Jiangsu Province, marine aquaculture areas do not have such distribution characteristics, and large areas of culture areas are distributed in the open sea. The author speculates that it may be caused by marine disasters such as typhoons, the impact of typhoons on southern China is stronger than in the north, the regional characteristics of the inner bay provide a natural safe haven for the breeding area, and the aquaculture activities in the inner bay are more conducive to reducing the damage of marine disasters such as typhoon storm surge to aquaculture than the open water.
Data uncertainty illustrates how this compares to statistical yearbooks:
The extracted results were counted and compared with the statistics on raft culture and cage culture area in the Chinese Fishery Statistics Yearbook for the same period. The two have certain differences, and the reasons for analyzing the differences mainly include the following 3 points:
1. Single-phase images are used when extracting, while the statistical yearbook counts the area of the whole year. When extracting the culture area, although the problem of the breeding cycle was considered, the image phase with strong spectral characteristics was selected as much as possible. However, the instantaneous remote sensing images still cannot fully show the different breeding cycles and growth states of the various types of farmed crops throughout the year, which is the most important reason for the discrepancy with the statistics.
2. Statistical standards are different. The culture area obtained in this study was calculated based on the resolution of the interpreted images and the number of cultured cells obtained by the interpretation. The area of culture in the statistical yearbook is not the area of water surface shown on the remote sensing image, many of which are estimated according to the number of breeding facilities, and there is no strict statistical standard in each region. To a certain extent, there is a difference between the extracted area and the statistical area.
3. Remote sensing extraction uncertainty. In addition to the algorithm itself will also produce a certain extraction error, the use of medium-resolution remote sensing images for automatic extraction of breeding areas in a large area will have some interference items, resulting in problems such as "isomorphism", "foreign body isospectral" and "mixed cell".
4 Conclusions of the study
1. China's offshore aquaculture areas are mainly located within 40 km of the coastline, and there are also some marine aquaculture areas around the islands beyond this range. Offshore aquaculture areas are mainly distributed in estuaries, inner bays and near islands.
2. Raft culture is mainly distributed in the northern and central regions of China, showing the distribution characteristics of "more north and less south". Raft culture in Liaoning Province, Shandong Province and Jiangsu Province exceeds 60% of the national raft culture area.
3. Cage culture is mainly distributed in the southern region of China, showing the distribution characteristics of "more south and less north". The area of cage culture in Fujian Province and Guangdong Province exceeds 80% of the national cage culture area.