作者:aylen
TiDB從2.1.8開始,information_schema中包含了SLOW_QUERY表。SLOW_QUERY 表中提供了慢查詢相關的資訊,其内容通過解析 TiDB 慢查詢日志而來,列名和慢日志中的字段名是一一對應。對于慢日志的解析,有很多實作的方法。那我們今天就來看看 TiDB 中慢日志解析是怎麼實作的吧。
Slow_query定義
TiDB 會将執行時間超過 slow-threshold(預設值為 300 毫秒)的語句輸出到 slow-query-file(預設值:”tidb-slow.log”)日志檔案中,用于幫助使用者定位慢查詢語句,分析和解決 SQL 執行的性能問題。
從3.0.5開始,TiDB慢日志中引入了執行計劃相關資訊,故slow_query的定義也發生了變化,具體如下:
var slowQueryCols = []columnInfo{
    {variable.SlowLogTimeStr, mysql.TypeTimestamp, 26, 0, nil, nil},
    {variable.SlowLogTxnStartTSStr, mysql.TypeLonglong, 20, mysql.UnsignedFlag, nil, nil},
    {variable.SlowLogUserStr, mysql.TypeVarchar, 64, 0, nil, nil},
    {variable.SlowLogHostStr, mysql.TypeVarchar, 64, 0, nil, nil},
    {variable.SlowLogConnIDStr, mysql.TypeLonglong, 20, mysql.UnsignedFlag, nil, nil},
    {variable.SlowLogQueryTimeStr, mysql.TypeDouble, 22, 0, nil, nil},
    {execdetails.ProcessTimeStr, mysql.TypeDouble, 22, 0, nil, nil},
    {execdetails.WaitTimeStr, mysql.TypeDouble, 22, 0, nil, nil},
    {execdetails.BackoffTimeStr, mysql.TypeDouble, 22, 0, nil, nil},
    {execdetails.RequestCountStr, mysql.TypeLonglong, 20, mysql.UnsignedFlag, nil, nil},
    {execdetails.TotalKeysStr, mysql.TypeLonglong, 20, mysql.UnsignedFlag, nil, nil},
    {execdetails.ProcessKeysStr, mysql.TypeLonglong, 20, mysql.UnsignedFlag, nil, nil},
    {variable.SlowLogDBStr, mysql.TypeVarchar, 64, 0, nil, nil},
    {variable.SlowLogIndexNamesStr, mysql.TypeVarchar, 100, 0, nil, nil},
    {variable.SlowLogIsInternalStr, mysql.TypeTiny, 1, 0, nil, nil},
    {variable.SlowLogDigestStr, mysql.TypeVarchar, 64, 0, nil, nil},
    {variable.SlowLogStatsInfoStr, mysql.TypeVarchar, 512, 0, nil, nil},
    {variable.SlowLogCopProcAvg, mysql.TypeDouble, 22, 0, nil, nil},
    {variable.SlowLogCopProcP90, mysql.TypeDouble, 22, 0, nil, nil},
    {variable.SlowLogCopProcMax, mysql.TypeDouble, 22, 0, nil, nil},
    {variable.SlowLogCopProcAddr, mysql.TypeVarchar, 64, 0, nil, nil},
    {variable.SlowLogCopWaitAvg, mysql.TypeDouble, 22, 0, nil, nil},
    {variable.SlowLogCopWaitP90, mysql.TypeDouble, 22, 0, nil, nil},
    {variable.SlowLogCopWaitMax, mysql.TypeDouble, 22, 0, nil, nil},
    {variable.SlowLogCopWaitAddr, mysql.TypeVarchar, 64, 0, nil, nil},
    {variable.SlowLogMemMax, mysql.TypeLonglong, 20, 0, nil, nil},
    {variable.SlowLogSucc, mysql.TypeTiny, 1, 0, nil, nil},
    {variable.SlowLogPlan, mysql.TypeLongBlob, types.UnspecifiedLength, 0, nil, nil},
    {variable.SlowLogPrevStmt, mysql.TypeLongBlob, types.UnspecifiedLength, 0, nil, nil},
    {variable.SlowLogQuerySQLStr, mysql.TypeLongBlob, types.UnspecifiedLength, 0, nil, nil},
}
較之前版本,增加了SlowLogPlan,用以存儲執行計劃。
Slow Query 字段含義說明
根據官方文檔,一些 Slow Query 的基礎字段含義如下:
注意:
慢查詢日志中所有時間相關字段的機關都是 “秒”
Slow Query 基礎資訊:
-
Time
-
Query_time
-
Query
Query
Query
-
Digest
-
Txn_start_ts
-
Is_internal
true
false
-
Index_ids
-
Succ
-
Backoff_time
tikv server is busy
和記憶體使用相關的字段:
-
Memory_max
和 SQL 執行的使用者相關的字段:
-
User
-
Conn_ID
con:3
-
DB
和 TiKV Coprocessor Task 相關的字段:
-
Request_count
-
Total_keys
-
Process_time
Query_time
-
Wait_time
-
Process_keys
-
Cop_proc_avg
-
Cop_proc_p90
-
Cop_proc_max
-
Cop_proc_addr
-
Cop_wait_avg
-
Cop_wait_p90
-
Cop_wait_max
-
Cop_wait_addr
讀取慢日志檔案
官方文檔中提到不支援多多個慢日志檔案的的解析,從源碼中可以很直覺的看出的。
// parseSlowLogFile uses to parse slow log file.
// TODO: Support parse multiple log-files.
func parseSlowLogFile(tz *time.Location, filePath string) ([][]types.Datum, error) {
  file, err := os.Open(filePath)
  if err != nil {
    return nil, errors.Trace(err)
  }
  defer func() {
    if err = file.Close(); err != nil {
      logutil.Logger(context.Background()).Error("close slow log file failed.", zap.String("file", filePath), zap.Error(err))
    }
  }()
  return ParseSlowLog(tz, bufio.NewReader(file))
}

// ParseSlowLog exports for testing.
// TODO: optimize for parse huge log-file.
func ParseSlowLog(tz *time.Location, reader *bufio.Reader) ([][]types.Datum, error) {
  var rows [][]types.Datum
  startFlag := false
  var st *slowQueryTuple
  for {
    lineByte, err := getOneLine(reader)
    if err != nil {
      if err == io.EOF {
        return rows, nil
      }
      return rows, err
    }
另外,官方文檔提到TiDB 通過 session 變量 tidb_slow_query_file 控制查詢 INFORMATION_SCHEMA.SLOW_QUERY 時要讀取和解析的檔案,可通過修改改 session 變量的值來查詢其他慢查詢日志檔案的内容:
set tidb_slow_query_file = "/path-to-log/tidb-slow.log" 慢日志解析時,擷取session的資訊如下:
func dataForSlowLog(ctx sessionctx.Context) ([][]types.Datum, error) {
  return parseSlowLogFile(ctx.GetSessionVars().Location(), ctx.GetSessionVars().SlowQueryFile)
}
慢日志的解析過程
1.判斷是不是慢日志的開始
line := string(hack.String(lineByte))
    // Check slow log entry start flag.
    if !startFlag && strings.HasPrefix(line, variable.SlowLogStartPrefixStr) {
      st = &slowQueryTuple{}
      err = st.setFieldValue(tz, variable.SlowLogTimeStr, line[len(variable.SlowLogStartPrefixStr):])
      if err != nil {
        return rows, err
      }
      startFlag = true
      continue
    }
與filebeat類似,通過設定起始字元串,來判斷慢日志的開始。使用setFieldValue可以将處理的資訊指派給對應的欄位,這塊将在下面講解。慢日志每行的起始值定義可以從sessionctx/variable/session.go中擷取這些起始值的相關定義,SlowLogStartPrefixStr的定義是# Time: ,即慢日志的開始時間,也是慢日志開始的标志。
const (
  // SlowLogRowPrefixStr is slow log row prefix.
  SlowLogRowPrefixStr = "# "
  // SlowLogSpaceMarkStr is slow log space mark.
  SlowLogSpaceMarkStr = ": "
  // SlowLogSQLSuffixStr is slow log suffix.
  SlowLogSQLSuffixStr = ";"
  // SlowLogTimeStr is slow log field name.
  SlowLogTimeStr = "Time"
  // SlowLogStartPrefixStr is slow log start row prefix.
  SlowLogStartPrefixStr = SlowLogRowPrefixStr + SlowLogTimeStr + SlowLogSpaceMarkStr
  // SlowLogTxnStartTSStr is slow log field name.
  SlowLogTxnStartTSStr = "Txn_start_ts"
  // SlowLogUserStr is slow log field name.
  SlowLogUserStr = "User"
  // SlowLogHostStr only for slow_query table usage.
  SlowLogHostStr = "Host"
  // SlowLogConnIDStr is slow log field name.
  SlowLogConnIDStr = "Conn_ID"
  // SlowLogQueryTimeStr is slow log field name.
  SlowLogQueryTimeStr = "Query_time"
  // SlowLogParseTimeStr is the parse sql time.
  SlowLogParseTimeStr = "Parse_time"
  // SlowLogCompileTimeStr is the compile plan time.
  SlowLogCompileTimeStr = "Compile_time"
  // SlowLogDBStr is slow log field name.
  SlowLogDBStr = "DB"
  // SlowLogIsInternalStr is slow log field name.
  SlowLogIsInternalStr = "Is_internal"
  // SlowLogIndexNamesStr is slow log field name.
  SlowLogIndexNamesStr = "Index_names"
  // SlowLogDigestStr is slow log field name.
  SlowLogDigestStr = "Digest"
  // SlowLogQuerySQLStr is slow log field name.
  SlowLogQuerySQLStr = "Query" // use for slow log table, slow log will not print this field name but print sql directly.
  // SlowLogStatsInfoStr is plan stats info.
  SlowLogStatsInfoStr = "Stats"
  // SlowLogNumCopTasksStr is the number of cop-tasks.
  SlowLogNumCopTasksStr = "Num_cop_tasks"
  // SlowLogCopProcAvg is the average process time of all cop-tasks.
  SlowLogCopProcAvg = "Cop_proc_avg"
  // SlowLogCopProcP90 is the p90 process time of all cop-tasks.
  SlowLogCopProcP90 = "Cop_proc_p90"
  // SlowLogCopProcMax is the max process time of all cop-tasks.
  SlowLogCopProcMax = "Cop_proc_max"
  // SlowLogCopProcAddr is the address of TiKV where the cop-task which cost max process time run.
  SlowLogCopProcAddr = "Cop_proc_addr"
  // SlowLogCopWaitAvg is the average wait time of all cop-tasks.
  SlowLogCopWaitAvg = "Cop_wait_avg"
  // SlowLogCopWaitP90 is the p90 wait time of all cop-tasks.
  SlowLogCopWaitP90 = "Cop_wait_p90"
  // SlowLogCopWaitMax is the max wait time of all cop-tasks.
  SlowLogCopWaitMax = "Cop_wait_max"
  // SlowLogCopWaitAddr is the address of TiKV where the cop-task which cost wait process time run.
  SlowLogCopWaitAddr = "Cop_wait_addr"
  // SlowLogMemMax is the max number bytes of memory used in this statement.
  SlowLogMemMax = "Mem_max"
  // SlowLogPrepared is used to indicate whether this sql execute in prepare.
  SlowLogPrepared = "Prepared"
  // SlowLogHasMoreResults is used to indicate whether this sql has more following results.
  SlowLogHasMoreResults = "Has_more_results"
  // SlowLogSucc is used to indicate whether this sql execute successfully.
  SlowLogSucc = "Succ"
  // SlowLogPrevStmt is used to show the previous executed statement.
  SlowLogPrevStmt = "Prev_stmt"
  // SlowLogPlan is used to record the query plan.
  SlowLogPlan = "Plan"
  // SlowLogPlanPrefix is the prefix of the plan value.
  SlowLogPlanPrefix = ast.TiDBDecodePlan + "('"
  // SlowLogPlanSuffix is the suffix of the plan value.
  SlowLogPlanSuffix = "')"
  // SlowLogPrevStmtPrefix is the prefix of Prev_stmt in slow log file.
  SlowLogPrevStmtPrefix = SlowLogPrevStmt + SlowLogSpaceMarkStr
)
2.解析非SQL語句相關資訊
if startFlag {
      // Parse slow log field.
      if strings.HasPrefix(line, variable.SlowLogRowPrefixStr) {
        line = line[len(variable.SlowLogRowPrefixStr):]
和判斷慢日志開始邏輯類似,通過判斷每行的起始資訊,每行的起始标志為SlowLogRowPrefixStr的定義如下:
const (
  // SlowLogRowPrefixStr is slow log row prefix.
  SlowLogRowPrefixStr = "# “
2.1處理事務相關的資訊
if strings.HasPrefix(line, variable.SlowLogPrevStmtPrefix) {
          st.prevStmt = line[len(variable.SlowLogPrevStmtPrefix):]
        }
舉個例子:
begin
Select * from test
Commit
當commit時,已經超過慢查詢的時間,如果隻記錄commit,會造成分析慢日志時的困惑,到底是什麼SQL引起的,通過記錄相關的上一條事務來更好的分析慢日志。 對SlowLogPrevStmtPrefix定義如下:
const (
...
  // SlowLogSpaceMarkStr is slow log space mark.
  SlowLogSpaceMarkStr = ": "
  // SlowLogPrevStmt is used to show the previous executed statement.
  SlowLogPrevStmt = "Prev_stmt"
...
  // SlowLogPrevStmtPrefix is the prefix of Prev_stmt in slow log file.
  SlowLogPrevStmtPrefix = SlowLogPrevStmt + SlowLogSpaceMarkStr
)
2.2 處理慢日志中的其他非SQL語句資訊
else {
          fieldValues := strings.Split(line, " ")
          for i := 0; i < len(fieldValues)-1; i += 2 {
            field := fieldValues[i]
            if strings.HasSuffix(field, ":") {
              field = field[:len(field)-1]
            }
            err = st.setFieldValue(tz, field, fieldValues[i+1])
            if err != nil {
              return rows, err
            }
          }
        }
      }
這時處理的是諸如執行時間、CPU耗時、DB等資訊。
3.解析SQL語句相關資訊
else if strings.HasSuffix(line, variable.SlowLogSQLSuffixStr) {
        // Get the sql string, and mark the start flag to false.
        err = st.setFieldValue(tz, variable.SlowLogQuerySQLStr, string(hack.Slice(line)))
判斷SQL的字尾,進行處理。SlowLogSQLSuffixStr的定義如下:
const (
  // SlowLogRowPrefixStr is slow log row prefix.
  SlowLogRowPrefixStr = "# "
  // SlowLogSpaceMarkStr is slow log space mark.
  SlowLogSpaceMarkStr = ": "
  // SlowLogSQLSuffixStr is slow log suffix.
  SlowLogSQLSuffixStr = “;"
…
4.資料格式的轉換
if err != nil {
          return rows, err
        }
        rows = append(rows, st.convertToDatumRow())
        startFlag = false
      } else {
        startFlag = false
      }
    }
将經過SQL語句經過setFieldValue處理後,一段慢日志也就分析完了,下面是資料的轉存儲過程,将上面簡單處理過的資料經過convertToDatumRow再次處理以滿足slow_query的存儲需求。同時将startFlag設定為false,以開始新的一段慢日志分析。
以上是慢日志處理的主要過程,下面将對其中涉及的兩個主要函數setFieldValue和convertToDatumRow進行解讀。
1.setFieldValue
功能是将解析的資料賦予對應的欄位,同時進行資料類型的轉換,其中ParseTime将慢日志的時間進行相容性解析。
func (st *slowQueryTuple) setFieldValue(tz *time.Location, field, value string) error {
  var err error
  switch field {
  case variable.SlowLogTimeStr:
    st.time, err = ParseTime(value)
    if err != nil {
      break
    }
    if st.time.Location() != tz {
      st.time = st.time.In(tz)
    }
  case variable.SlowLogTxnStartTSStr:
    st.txnStartTs, err = strconv.ParseUint(value, 10, 64)
  case variable.SlowLogUserStr:
    fields := strings.SplitN(value, "@", 2)
    if len(field) > 0 {
      st.user = fields[0]
    }
    if len(field) > 1 {
      st.host = fields[1]
    }
  case variable.SlowLogConnIDStr:
    st.connID, err = strconv.ParseUint(value, 10, 64)
  case variable.SlowLogQueryTimeStr:
    st.queryTime, err = strconv.ParseFloat(value, 64)
  case execdetails.ProcessTimeStr:
    st.processTime, err = strconv.ParseFloat(value, 64)
  case execdetails.WaitTimeStr:
    st.waitTime, err = strconv.ParseFloat(value, 64)
  case execdetails.BackoffTimeStr:
    st.backOffTime, err = strconv.ParseFloat(value, 64)
  case execdetails.RequestCountStr:
    st.requestCount, err = strconv.ParseUint(value, 10, 64)
  case execdetails.TotalKeysStr:
    st.totalKeys, err = strconv.ParseUint(value, 10, 64)
  case execdetails.ProcessKeysStr:
    st.processKeys, err = strconv.ParseUint(value, 10, 64)
  case variable.SlowLogDBStr:
    st.db = value
  case variable.SlowLogIndexNamesStr:
    st.indexIDs = value
  case variable.SlowLogIsInternalStr:
    st.isInternal = value == "true"
  case variable.SlowLogDigestStr:
    st.digest = value
  case variable.SlowLogStatsInfoStr:
    st.statsInfo = value
  case variable.SlowLogCopProcAvg:
    st.avgProcessTime, err = strconv.ParseFloat(value, 64)
  case variable.SlowLogCopProcP90:
    st.p90ProcessTime, err = strconv.ParseFloat(value, 64)
  case variable.SlowLogCopProcMax:
    st.maxProcessTime, err = strconv.ParseFloat(value, 64)
  case variable.SlowLogCopProcAddr:
    st.maxProcessAddress = value
  case variable.SlowLogCopWaitAvg:
    st.avgWaitTime, err = strconv.ParseFloat(value, 64)
  case variable.SlowLogCopWaitP90:
    st.p90WaitTime, err = strconv.ParseFloat(value, 64)
  case variable.SlowLogCopWaitMax:
    st.maxWaitTime, err = strconv.ParseFloat(value, 64)
  case variable.SlowLogCopWaitAddr:
    st.maxWaitAddress = value
  case variable.SlowLogMemMax:
    st.memMax, err = strconv.ParseInt(value, 10, 64)
  case variable.SlowLogSucc:
    st.succ, err = strconv.ParseBool(value)
  case variable.SlowLogPlan:
    st.plan = value
  case variable.SlowLogQuerySQLStr:
    st.sql = value
  }
  if err != nil {
    return errors.Wrap(err, "parse slow log failed `"+field+"` error")
  }
  return nil
}
2.convertToDatumRow
功能是将指派後的資料進行類型轉換已滿足定義需求,同時使用parsePlan将執行計劃進行解析以便更友善存儲。
func (st *slowQueryTuple) convertToDatumRow() []types.Datum {
  record := make([]types.Datum, 0, len(slowQueryCols))
  record = append(record, types.NewTimeDatum(types.Time{
    Time: types.FromGoTime(st.time),
    Type: mysql.TypeDatetime,
    Fsp:  types.MaxFsp,
  }))
  record = append(record, types.NewUintDatum(st.txnStartTs))
  record = append(record, types.NewStringDatum(st.user))
  record = append(record, types.NewStringDatum(st.host))
  record = append(record, types.NewUintDatum(st.connID))
  record = append(record, types.NewFloat64Datum(st.queryTime))
  record = append(record, types.NewFloat64Datum(st.processTime))
  record = append(record, types.NewFloat64Datum(st.waitTime))
  record = append(record, types.NewFloat64Datum(st.backOffTime))
  record = append(record, types.NewUintDatum(st.requestCount))
  record = append(record, types.NewUintDatum(st.totalKeys))
  record = append(record, types.NewUintDatum(st.processKeys))
  record = append(record, types.NewStringDatum(st.db))
  record = append(record, types.NewStringDatum(st.indexIDs))
  record = append(record, types.NewDatum(st.isInternal))
  record = append(record, types.NewStringDatum(st.digest))
  record = append(record, types.NewStringDatum(st.statsInfo))
  record = append(record, types.NewFloat64Datum(st.avgProcessTime))
  record = append(record, types.NewFloat64Datum(st.p90ProcessTime))
  record = append(record, types.NewFloat64Datum(st.maxProcessTime))
  record = append(record, types.NewStringDatum(st.maxProcessAddress))
  record = append(record, types.NewFloat64Datum(st.avgWaitTime))
  record = append(record, types.NewFloat64Datum(st.p90WaitTime))
  record = append(record, types.NewFloat64Datum(st.maxWaitTime))
  record = append(record, types.NewStringDatum(st.maxWaitAddress))
  record = append(record, types.NewIntDatum(st.memMax))
  if st.succ {
    record = append(record, types.NewIntDatum(1))
  } else {
    record = append(record, types.NewIntDatum(0))
  }
  record = append(record, types.NewStringDatum(parsePlan(st.plan)))
  record = append(record, types.NewStringDatum(st.prevStmt))
  record = append(record, types.NewStringDatum(st.sql))
  return record
}
定位問題語句的方法(官方推薦)
并不是所有 SLOW_QUERY 的語句都是有問題的。會造成叢集整體壓力增大的,是那些 process_time 很大的語句。wait_time 很大,但 process_time 很小的語句通常不是問題語句,是因為被問題語句阻塞,在執行隊列等待造成的響應時間過長。
admin show slow
admin show slow
除了擷取 TiDB 日志,還有一種定位慢查詢的方式是通過
admin show slow
SQL 指令:
admin show slow recent N; admin show slow top [internal | all] N;
recent N
會顯示最近的 N 條慢查詢記錄,例如:
admin show slow recent 10;
top N
則顯示最近一段時間(大約幾天)内,最慢的查詢記錄。如果指定
internal
選項,則傳回查詢系統内部 SQL 的慢查詢記錄;如果指定
all
選項,傳回系統内部和使用者 SQL 彙總以後的慢查詢記錄;預設隻傳回使用者 SQL 中的慢查詢記錄。
admin show slow top 3;
admin show slow top internal 3;
admin show slow top all 5;
由于記憶體限制,保留的慢查詢記錄的條數是有限的。當指令查詢的
N
大于記錄條數時,傳回的結果記錄條數會小于
N
。
輸出内容詳細說明,如下:
| 列名 | 描述 |
| start | SQL 語句執行開始時間 |
| duration | SQL 語句執行持續時間 |
| details | 執行語句的詳細資訊 |
| succ | SQL 語句執行是否成功,1: 成功,0: 失敗 |
| conn_id | session 連接配接 ID |
| transcation_ts | 事務送出的 commit ts |
| user | 執行該語句的使用者名 |
| db | 執行該 SQL 涉及到 database |
| table_ids | 執行該 SQL 涉及到表的 ID |
| index_ids | 執行該 SQL 涉及到索引 ID |
| internal | 表示為 TiDB 内部的 SQL 語句 |
| digest | 表示 SQL 語句的指紋 |
| sql | 執行的 SQL 語句 |
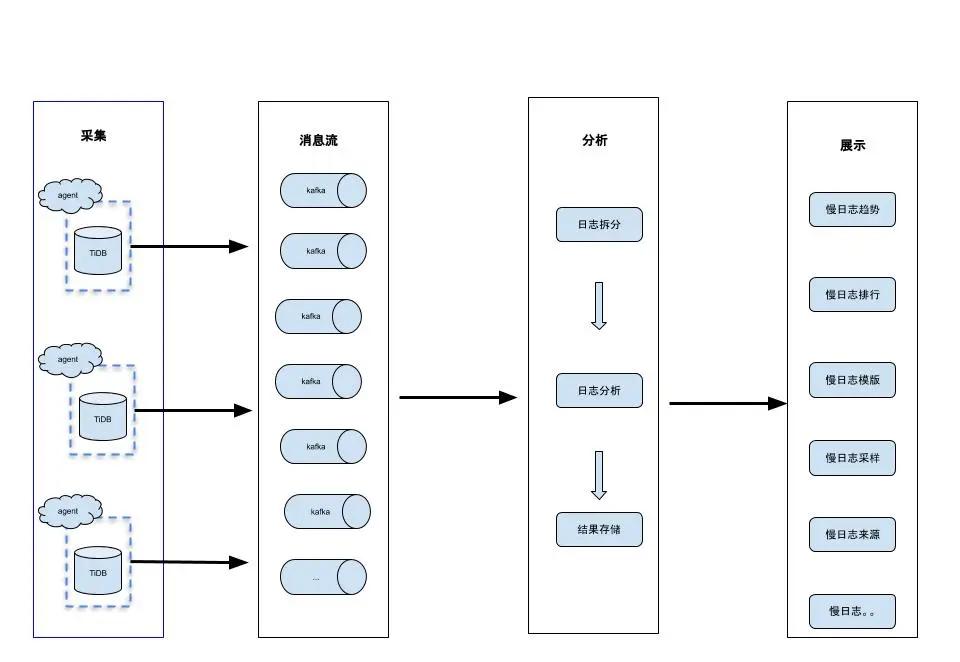
定位問題語句的方法(個人經驗)
雖然官方提供了簡便的定位慢查詢的方法,但因其保留時間短,不便于後續的慢日志的追蹤和預警。是以建議大家可以基于上述的慢日志解析原理,建構自己的慢日志系統和工具。下圖是常見的慢日志分析系統架構:
![SQL優化SQL語句優化的目的[圖]](data:image/gif;base64,R0lGODlhAQABAIAAAP///wAAACwAAAAAAQABAAACAkQBADs=)