最近幾天很多同學私信小編有沒有關于氣象繪圖的可視化資源?小編這邊也趕快把我收藏的一個關于氣象可視化作品集的優質資源整理分享出來了,看吧,小編照顧讀者不?
今天小編就介紹下Python環境中優質的關于氣象可視化的優質資源-cf-plot,具體内容包括:
- cf-plot的簡單介紹
- cf-plot的示例展示
讓小夥伴們更好的了解和掌握這個優質的可視化資源~~
cf-plot的簡單介紹
cf-plot 是一組Python示例教程集合,主要用于制作氣候研究中的常見等高線(contour)、矢量(vector)和線圖(line plots)等。cf-plot一般使用cf-python來呈現資料和CF屬性進行繪圖,還可以使用 numpy 資料數組作為輸入字段,進而靈活地繪制資料。
更多詳細内容可參考:cf-plot介紹[1]。
cf-plot的示例展示
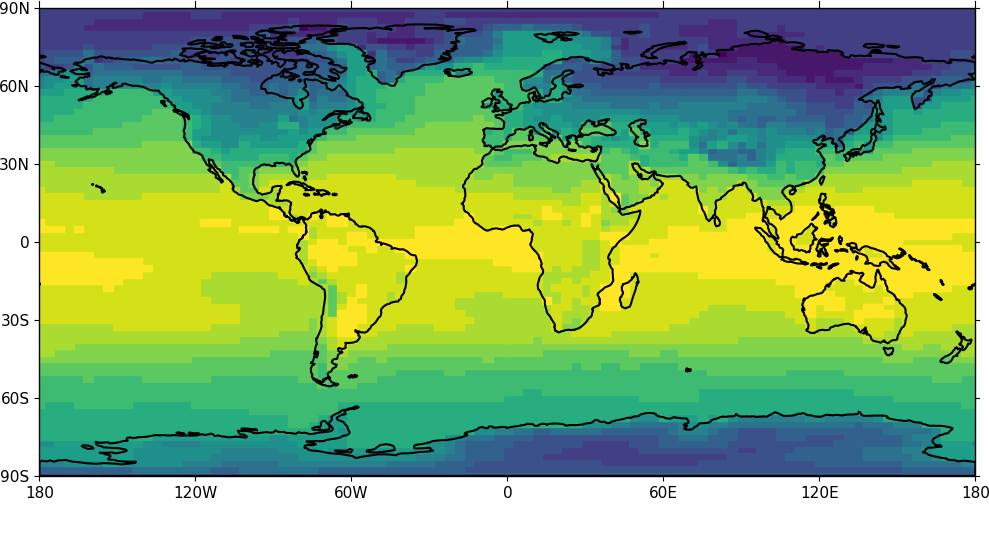
Blockfill plots
import cf
import cfplot as cfp
f=cf.read('cfplot_data/tas_A1.nc')[0]
cfp.con(f.subspace(time=15), blockfill=True, lines=False)
複制
Blockfill plots
Polar stereographic plots
import cf
import cfplot as cfp
f=cf.read('cfplot_data/ggap.nc')[1]
cfp.mapset(proj='npstere')
cfp.con(f.subspace(pressure=500))
複制

Polar stereographic plots
import cf
import cfplot as cfp
f=cf.read('cfplot_data/ggap.nc')[1]
cfp.mapset(proj='spstere', boundinglat=-30, lon_0=0)
cfp.con(f.subspace(pressure=500))
複制
Polar stereographic plots
Latitude - Pressure Plots
import cf
import cfplot as cfp
f=cf.read('cfplot_data/ggap.nc')[1]
cfp.con(f.collapse('mean','longitude'), ylog=True)
複制
Latitude - Pressure Plots
Hovmuller plots
import cf
import cfplot as cfp
f=cf.read('cfplot_data/tas_A1.nc')[0]
cfp.cscale('plasma')
cfp.con(f.subspace(longitude=0), lines=0)
複制
Hovmuller plots
Vector and stream Plots
import cf
import cfplot as cfp
f=cf.read('cfplot_data/ggap.nc')
u=f[1].subspace(pressure=500)
v=f[2].subspace(pressure=500)
cfp.vect(u=u, v=v, key_length=10, scale=100, stride=5)
複制
Multiple plots on a page and plot positioning
import cf
import cfplot as cfp
f=cf.read('cfplot_data/ggap.nc')[1]

cfp.gopen(rows=2, columns=2, bottom=0.2)
cfp.gpos(1)
cfp.con(f.subspace(pressure=500), lines=False, colorbar=None)
cfp.gpos(2)
cfp.mapset(proj='moll')
cfp.con(f.subspace(pressure=500), lines=False, colorbar=None)
cfp.gpos(3)
cfp.mapset(proj='npstere', boundinglat=30, lon_0=180)
cfp.con(f.subspace(pressure=500), lines=False, colorbar=None)
cfp.gpos(4)
cfp.mapset(proj='spstere', boundinglat=-30, lon_0=0)
cfp.con(f.subspace(pressure=500), lines=False, colorbar_position=[0.1, 0.1, 0.8, 0.02],
        colorbar_orientation='horizontal')
cfp.gclose()
複制
Multiple plots on a page and plot positioning
Stipple plots
import cf
import cfplot as cfp
f=cf.read('cfplot_data/tas_A1.nc')[0]
g=f.subspace(time=15)
cfp.gopen()
cfp.cscale('magma')
cfp.con(g)
cfp.stipple(f=g, min=220, max=260, size=100, color='#00ff00')
cfp.stipple(f=g, min=300, max=330, size=50, color='#0000ff', marker='s')
cfp.gclose()
複制
以上就是小編介紹的關于cf-plot的具體示例介紹,更多其他案例可查閱:cf-plot示例[2]
總結
今天小編給大家介紹了一個優秀的關于氣象領域的可視化工具-cf-plot 及其優秀的示例,希望大家可以從中學習到繪圖技巧和繪圖靈感~~
參考資料
[1]cf-plot介紹: http://ajheaps.github.io/cf-plot/。
[2]cf-plot示例: http://ajheaps.github.io/cf-plot/gallery.html。