描述 (Description)
Fixing and preventing performance problems is critical to the success of any application. We will use a variety of tools and best practices to provide a set of techniques that can be used to analyze and speed up any performance problem!
修複和防止性能問題對于任何應用程式的成功都是至關重要的。 我們将使用各種工具和最佳實踐來提供可用于分析和加速任何性能問題的技術!
This is one of my personal favorite areas of research and discussion as it is inherently satisfying. Taking a performance nightmare and tuning it into something fast and sleek feels great and will undoubtedly make others happy.
這是我個人最喜歡的研究和讨論領域之一,因為它本質上令人滿意。 參加一場表演噩夢并将其調整為快速而時尚的感覺真是太好了,并且無疑會讓其他人感到高興。
I often view optimization as a detective mystery. Something terrible has happened and you need to follow clues to locate and apprehend the culprit! This series of articles is all about these clues, how to identify them, and how to use them in order to find the root cause of a performance problem.
我經常将優化視為偵探之謎。 發生了一件可怕的事情,您需要遵循線索來找到并逮捕罪魁禍首! 本系列文章全部涉及這些線索,如何識别它們以及如何使用它們以查找性能問題的根本原因。
-
For more information about Query optimization, see the SQL Query Optimization — How to Determine When and If It’s Needed article
有關查詢優化的更多資訊,請參見“ SQL查詢優化-如何确定何時以及是否需要”一文。
定義優化 (Defining Optimization)
What is “optimal”? The answer to this will also determine when we are done with a problem and can move onto the next one. Often, a query can be sped up through many different means, each of which has an associated time and resource cost.
什麼是“最佳”? 答案也将決定我們何時解決問題,并可以繼續解決下一個問題。 通常,可以通過許多不同的方式加快查詢的速度,每種方式都有相關的時間和資源成本。
We usually cannot spend the resources needed to make a script run as fast as possible, nor should we want to. For the sake of simplicity, we will define “optimal” as the point at which a query performs acceptably and will continue to do so for a reasonable amount of time in the future. This is as much as a business definition as it is a technical definition. With infinite money, time, and computing resources, anything is possible, but we do not have the luxury of unlimited resources, and therefore must define what “done” is whenever we chase any performance problem.
我們通常不能花費使腳本盡可能快地運作所需的資源,我們也不應該這樣做。 為了簡單起見,我們将“最佳”定義為查詢可接受的執行點,并且在将來的合理時間内将繼續執行該操作。 這既是業務定義,又是技術定義。 有了無限的金錢,時間和計算資源,一切皆有可能,但是我們沒有無限資源的奢侈,是以,當我們追求任何性能問題時,必須定義“完成”是什麼。
This provides us with several useful checkpoints that will force us to re-evaluate our progress as we optimize:
這為我們提供了幾個有用的檢查點,這些檢查點将迫使我們在優化時重新評估我們的進度:
-
The query now performs adequately.
查詢現在可以正常執行。
-
The resources needed to optimize further are very expensive.
進一步優化所需的資源非常昂貴。
-
We have reached a point of diminishing returns for any further optimization.
對于任何進一步的優化,我們已經達到了收益遞減的地步。
-
A completely different solution is discovered that renders this unneeded.
發現了一個完全不同的解決方案,進而不需要此解決方案。
Over-optimization sounds good, but in the context of resource management is generally wasteful. A giant (but unnecessary) covering index will cost us computing resources whenever we write to a table for the rest of eternity (a long time). A project to rewrite code that was already acceptable might cost days or weeks of development and QA time. Trying to further tweak an already good query may net a gain of 3%, but take a week of sweating to get there.
過度優化聽起來不錯,但是在資源管理的情況下通常是浪費的。 每當我們在永恒的餘下時間(很長一段時間)中向表寫入資料時,一個龐大的(但不必要的)覆寫索引将使我們浪費計算資源。 重寫已經可以接受的代碼的項目可能會花費數天或數周的開發和品質檢查時間。 嘗試進一步調整本來不錯的查詢可能會獲得3%的收益,但要花上一周的時間才能達到目标。
Our goal is to solve a problem and not over-solve it.
我們的目标是解決問題,而不是過度解決。
查詢做什麼? (What Does the Query Do?)
Question #1 that we must always answer is: What is the purpose of a query?
我們必須始終回答的問題#1:查詢的目的是什麼?
-
What is its purpose?
目的是什麼?
-
What should the result set look like?
結果集應該是什麼樣?
-
What sort of code, report, or UI is generating the query?
什麼樣的代碼,報告或UI會生成查詢?
It is first-nature for us to want to dive in with a sword in hand and slay the dragon as quickly as humanly possible. We have a trace running, execution plans in hand, and a pile of IO and timing statistics collected before realizing that we have no idea what we are doing 🙂
我們想用手中的劍跳入水中并盡快殺死人,這是我們的天性。 在意識到我們不知道自己在做什麼之前,我們有一個跟蹤運作,手頭的執行計劃以及一堆IO和時序統計資訊🙂
Step #1 is to step back and understand the query. Some helpful questions that can aid in optimization:
步驟#1是退後一步并了解查詢。 一些有助于優化的有用問題:
- How large is the result set? Should we brace ourselves for a million rows returned, or just a few? 結果集有多大? 我們應該為傳回的一百萬行還是為幾行做好準備?
- Are there any parameters that have limited values? Will a given parameter always have the same value, or are there other limitations on values that can simplify our work by eliminating avenues of research. 是否有任何值有限的參數? 給定的參數将始終具有相同的值,還是在值上存在其他限制,可以通過消除研究途徑來簡化我們的工作。
- How often is the query executed? Something that occurs once a day will be treated very differently than one that is run every second. 查詢多久執行一次? 每天發生一次的事情與每秒運作一次的事情将有很大不同。
- Are there any invalid or unusual input values that are indicative of an application problem? Is one input set to NULL, but never should be NULL? Are any other inputs set to values that make no sense, are contradictory, or otherwise go against the use-case of the query? 是否有任何訓示應用程式問題的無效或異常輸入值? 一個輸入是否設定為NULL,但永遠不應為NULL? 是否将其他任何輸入設定為沒有意義,自相沖突或違反查詢用例的值?
- Are there any obvious logical, syntactical, or optimization problems staring us in the face? Do we see any immediate performance bombs that will always perform poorly, regardless of parameter values or other variables? More on these later when we discuss optimization techniques. 有沒有明顯的邏輯,句法或優化問題盯着我們? 我們是否看到任何即時性能炸彈,無論參數值或其他變量如何,總是會表現不佳? 稍後,當我們讨論優化技術時,将詳細介紹這些内容。
- What is acceptable query performance? How fast must the query be for its consumers to be happy? If server performance is poor, how much do we need to decrease resource consumption for it to be acceptable? Lastly, what is the current performance of the query? This will provide us with a baseline so we know how much improvement is needed. 可接受的查詢性能是什麼? 查詢必須多快才能使消費者滿意? 如果伺服器性能不佳,我們需要減少多少資源消耗才能使伺服器可接受? 最後,查詢的目前性能如何? 這将為我們提供基線,是以我們知道需要多少改進。
By stopping and asking these questions prior to optimizing a query, we avoid the uncomfortable situation in which we spend hours collecting data about a query only to not fully understand how to use it. In many ways, query optimization and database design force us to ask many of the same questions.
通過在優化查詢之前停止并提出這些問題,我們避免了這種不舒服的情況,在這種情況下,我們花費數小時來收集有關查詢的資料隻是為了不完全了解如何使用它。 在許多方面,查詢優化和資料庫設計迫使我們提出許多相同的問題。
The results of this additional foresight will often lead us to more innovative solutions. Maybe a new index isn’t needed and we can break a big query into a few smaller ones. Maybe one parameter value is incorrect and there is a problem in code or the UI that needs to be resolved. Maybe a report is run once a week, so we can pre-cache the data set and send the results to an email, dashboard, or file, rather than force a user wait 10 minutes for it interactively.
這種額外的遠見卓識往往會導緻我們獲得更多創新的解決方案。 也許不需要新索引,我們可以将一個大查詢分解為幾個較小的查詢。 可能一個參數值不正确,并且代碼或UI中存在問題需要解決。 也許報告每周運作一次,是以我們可以預先緩存資料集并将結果發送到電子郵件,儀表闆或檔案,而不必強迫使用者以互動方式等待10分鐘。
工具類 (Tools)
To keep things simple, we’ll use only a handful of tools in this article:
為簡單起見,本文中将僅使用少數工具:
執行計劃 (Execution Plans)
An execution plan provides a graphical representation of how the query optimizer chose to execute a query:
執行計劃提供了查詢優化器如何選擇執行查詢的圖形表示:
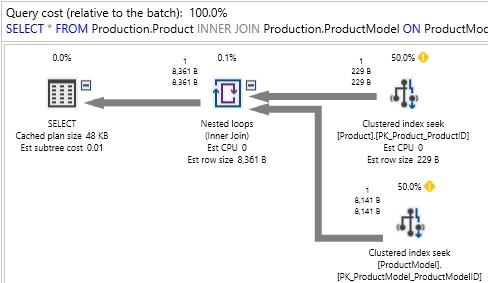
The execution plan shows us which tables were accessed, how they were accessed, how they were joined together, and any other operations that occurred along the way. Included are query costs, which are estimates of the overall expense of any query component. A treasure trove of data is also included, such as row size, CPU cost, I/O cost, and details on which indexes were utilized.
執行計劃向我們顯示通路了哪些表,如何通路它們,如何将它們連接配接在一起以及在此過程中發生的任何其他操作。 其中包括查詢成本,這是對任何查詢元件的總費用的估計。 還包括大量資料,例如行大小,CPU成本,I / O成本以及使用索引的詳細資訊。
In general, what we are looking for are scenarios in which large numbers of rows are being processed by any given operation within the execution plan. Once we have found a high cost component, we can zoom in on what the cause is and how to resolve it.
通常,我們要尋找的是執行計劃中的任何給定操作正在處理大量行的場景。 一旦找到了高成本的組成部分,我們就可以放大原因并解決問題。
統計IO (STATISTICS IO)
This allows us to see how many logical and physical reads are made when a query is executed and may be turned on interactively in SQL Server Management Studio by running the following TSQL:
這使我們可以檢視執行查詢時進行了多少邏輯和實體讀取,并且可以通過運作以下TSQL在SQL Server Management Studio中以互動方式打開它:
SET STATISTICS IO ON;
将統計資訊IO設定為ON;
Once on, we will see additional data included in the Messages pane:
啟用之後,我們将在“消息”窗格中看到其他資料:

Logical reads tell us how many reads were made from the buffer cache. This is the number that we will refer to whenever we talk about how many reads a query is responsible for, or how much IO it is causing.
邏輯讀取告訴我們從緩沖區高速緩存進行了多少次讀取。 每當談論一個查詢負責多少次讀取或引起多少IO時,我們都将使用此數字。
Physical reads tell us how much data was read from a storage device as it was not yet present in memory. This can be a useful indication of buffer cache/memory capacity problems if data is very frequently being read from storage devices, rather than memory.
實體讀取告訴我們從儲存設備讀取了多少資料,因為它們尚未出現在記憶體中。 如果經常從儲存設備而非記憶體中讀取資料,這可能是緩沖區高速緩存/記憶體容量問題的有用訓示。
In general, IO will be the primary cause of latency and bottlenecks when analyzing slow queries. The unit of measurement of STATISTICS IO = 1 read = a single 8kb page = 8192 bytes.
通常,在分析慢查詢時,IO将成為延遲和瓶頸的主要原因。 STATISTICS IO的度量機關= 1讀取=一個8kb頁面= 8192位元組。
查詢時長 (Query Duration)
Typically, the #1 reason we will research a slow query is because someone has complained and told us that it is too slow. The time it takes a query to execute is going to often be the smoking gun that leads us to a performance problem in need of a solution.
通常,我們研究緩慢查詢的第一原因是因為有人抱怨并告訴我們它太慢了。 執行查詢所花費的時間通常是抽煙,這導緻我們遇到需要解決方案的性能問題。
For our work here, we will measure duration manually using the timer found in the lower-right hand corner of SSMS:
對于此處的工作,我們将使用SSMS右下角的計時器手動測量持續時間:
There are other ways to accurately measure query duration, such as setting on STATISTICS TIME, but we’ll focus on queries that are slow enough that such a level of accuracy will not be necessary. We can easily observe when a 30 second query is improved to run in sub-second time. This also reinforces the role of the user as a constant source of feedback as we try to improve the speed of an application.
還有其他一些方法可以精确地測量查詢持續時間,例如在STATISTICS TIME上進行設定,但是我們将重點放在足夠慢的查詢上,以至于不需要這樣的準确性。 我們可以輕松地觀察到30秒的查詢何時可以改進以在亞秒内運作。 當我們試圖提高應用程式速度時,這也加強了使用者作為不斷回報源的作用。
我們的眼睛 (Our Eyes)
Many performance problems are the result of common query patterns that we will become familiar with below. This pattern recognition allows us to short-circuit a great deal of research when we see something that is clearly poorly written.
許多性能問題是我們将在下面熟悉的常見查詢模式的結果。 當我們看到明顯寫得不好的東西時,這種模式識别使我們可以将大量研究短路。
As we optimize more and more queries, quickly identifying these indicators becomes more second-nature and we’ll get the pleasure of being able to fix a problem quickly, without the need for very time-consuming research.
随着我們對越來越多的查詢進行優化,快速識别這些名額變得更加自然,我們将很高興能夠快速解決問題,而無需進行非常耗時的研究。
In addition to common query mistakes, we will also look out for any business logic hints that may tell us if there is an application problem, parameter issue, or some other flaw in how the query was generated that may require involvement from others aside from us.
除了常見的查詢錯誤外,我們還将尋找可能告訴我們是否存在應用程式問題,參數問題或查詢生成方式中是否存在其他一些缺陷的業務邏輯提示,這些缺陷可能需要我們以外的其他人參與。
查詢優化器做什麼? (What Does the Query Optimizer Do?)
Every query follows the same basic process from TSQL to completing execution on a SQL Server:
從TSQL到在SQL Server上完成執行,每個查詢都遵循相同的基本過程:
Parsing is the process by which query syntax is checked. Are keywords valid and are the rules of the TSQL language being followed correctly. If you made a spelling error, named a column using a reserved word, or forgot a semicolon before a common table expression, this is where you’ll get error messages informing you of those problems.
解析是檢查查詢文法的過程。 關鍵字是否有效,是否正确遵循TSQL語言的規則? 如果您犯了拼寫錯誤,使用保留字命名了列或在公用表表達式之前忘記了分号,那麼您将在此處收到錯誤消息,以通知您這些問題。
Binding checks all objects referenced in your TQL against the system catalogs and any temporary objects defined within your code to determine if they are both valid and referenced correctly. Information about these objects is retrieved, such as data types, constraints, and if a column allows NULL or not. The result of this step is a query tree that is composed of a basic list of the processes needed to execute the query. This provides basic instructions, but does not yet include specifics, such as which indexes or joins to use.
綁定檢查系統目錄中TQL中引用的所有對象以及代碼中定義的任何臨時對象,以确定它們是否有效并正确引用。 檢索有關這些對象的資訊,例如資料類型,限制以及列是否允許為NULL。 此步驟的結果是一個查詢樹,該樹由執行查詢所需的基本過程清單組成。 這提供了基本說明,但尚未包括具體說明,例如要使用的索引或聯接。
Optimization is the process that we will reference most often here. The optimizer operates similarly to a chess (or any gaming) computer. It needs to consider an immense number of possible moves as quickly as possible, remove the poor choices, and finish with the best possible move. At any point in time, there may be millions of combinations of moves available for the computer to consider, of which only a handful will be the best possible moves. Anyone that has played chess against a computer knows that the less time the computer has, the more likely it is to make an error.
優化是我們在這裡最常引用的過程。 優化器的操作類似于象棋(或任何遊戲)計算機。 它需要盡快考慮大量可能的動作,消除錯誤的選擇,并以最佳的動作完成。 在任何時間點,計算機都會考慮數百萬種動作組合,其中隻有極少數是最佳動作。 對計算機下過象棋的任何人都知道,計算機擁有的時間越短,出錯的可能性就越大。
In the world of SQL Server, we will talk about execution plans instead of chess moves. The execution plan is the set of specific steps that the execution engine will follow to process a query. Every query has many choices to make to arrive at that execution plan and must do so in a very short span of time.
在SQL Server的世界中,我們将讨論執行計劃而不是象棋棋步。 執行計劃是執行引擎處理查詢所遵循的一組特定步驟。 每個查詢都有很多選擇可以到達執行計劃,并且必須在很短的時間内完成。
These choices include questions such as:
這些選擇包括以下問題:
-
What order should tables be joined?
表應該以什麼順序連接配接?
-
What joins should be applied to tables?
什麼聯接應應用于表?
-
Which indexes should be used?
應該使用哪些索引?
-
Should a seek or scan be used against a given table?
是否應針對給定的表使用搜尋或掃描?
-
Is there a benefit in caching data in a worktable or spooling data for future use?
将資料緩存在工作表中或假脫機資料以備将來使用是否有好處?
Any execution plan that is considered by the optimizer must return the same results, but the performance of each plan may differ due to those questions above (and many more!).
優化程式考慮的任何執行計劃都必須傳回相同的結果,但是每個計劃的性能可能會由于上述問題(甚至更多!)而有所不同。
Query optimization is a CPU-intensive operation. The process to sift through plans requires significant computing resources and to find the best plan may require more time than is available. As a result, a balance must be maintained between the resources needed to optimize the query, the resources required to execute the query, and the time we must wait for the entire process to complete. As a result, the optimizer is not built to select the best execution plan, but instead to search and find the best possible plan after a set amount of time passes. It may not be the perfect execution plan, but we accept that as a limitation of how a process with so many possibilities must operate.
查詢優化是一項占用大量CPU的操作。 篩選計劃的過程需要大量的計算資源,而找到最佳計劃可能需要比可用時間更多的時間。 是以,必須在優化查詢所需的資源,執行查詢所需的資源以及必須等待整個過程完成的時間之間保持平衡。 結果,優化器不是為了選擇最佳執行計劃而建構的,而是經過一定時間後搜尋并找到最佳可能的計劃。 這可能不是一個完美的執行計劃,但我們接受這是一個限制,要求必須處理具有多種可能性的流程。
The metric used to judge execution plans and decide which to consider or not is query cost. The cost has no unit and is a relative measure of the resources required to execute each step of an execution plan. The overall query cost is the sum of the costs of each step within a query. You can view these costs in any execution plan:
用于判斷執行計劃并決定考慮或不考慮的名額是查詢成本。 成本沒有機關,是執行計劃的每個步驟所需資源的相對度量。 總查詢成本是查詢中每個步驟的成本之和。 您可以在任何執行計劃中檢視這些成本:
Subtree costs for each component of a query are calculated and used to either:
計算查詢每個組成部分的子樹成本,并将其用于以下任一情況:
-
Remove a high-cost execution plan and any similar ones from the pool of available plans.
從可用計劃池中删除高成本的執行計劃以及任何類似的計劃。
-
Rank the remaining plans based on how low their cost is.
根據剩餘計劃的成本降低其排名。
While query cost is a useful metric to understand how SQL Server has optimized a particular query, it is important to remember that its primary purpose is to aid the query optimizer in choosing good execution plans. It is not a direct measure of IO, CPU, memory, duration, or any other metric that matters to an application user waiting for query execution to complete. A low query cost may not indicate a fast query or the best plan. Alternatively, a high query cost may sometimes be acceptable. As a result, it’s best to not rely heavily on query cost as a metric of performance.
雖然查詢成本是了解SQL Server如何優化特定查詢的有用名額,但重要的是要記住,它的主要目的是幫助查詢優化器選擇良好的執行計劃。 它不是IO,CPU,記憶體,持續時間或任何其他對等待查詢執行完成的應用程式使用者重要的名額的直接度量。 低查詢成本可能并不表示快速查詢或最佳計劃。 備選地,有時可以接受高查詢成本。 是以,最好不要過分依賴查詢成本作為性能名額。
As the query optimizer churns through candidate execution plans, it will rank them from lowest cost to highest cost. Eventually, the optimizer will reach one of the following conclusions:
當查詢優化器周遊候選執行計劃時,它将把它們從最低成本到最高成本進行排名。 最終,優化器将得出以下結論之一:
-
Every execution plan has been evaluated and the best one chosen.
每個執行計劃都經過評估,并選擇了最佳執行計劃。
-
There isn’t enough time to evaluate every plan, and the best one thus far is chosen.
沒有足夠的時間來評估每個計劃,是以選擇了迄今為止最好的計劃。
Once an execution plan is chosen, the query optimizer’s job is complete and we can move to the final step of query processing.
一旦選擇了執行計劃,查詢優化器的工作便完成了,我們可以進入查詢處理的最後一步。
Execution is the final step. SQL Server takes the execution plan that was identified in the optimization step and follows those instructions in order to execute the query.
執行是最後一步。 SQL Server采用在優化步驟中确定的執行計劃,并遵循這些指令以執行查詢。
A note on plan reuse: Because optimizing is an inherently expensive process, SQL Server maintains an execution plan cache that stores details about each query executed on a server and the plan that was chosen for it. Typically, databases experience the same queries executed over and over again, such as a web search, order placement, or social media post. Reuse allows us to avoid the expensive optimization process and rely on the work we have previously done to optimize a query.
關于計劃重用的注釋:由于優化是一個固有的昂貴過程,是以SQL Server維護一個執行計劃緩存,該緩存存儲有關在伺服器上執行的每個查詢以及為其選擇的計劃的詳細資訊。 通常,資料庫會經曆一遍又一遍執行的相同查詢,例如Web搜尋,訂單放置或社交媒體文章。 重用使我們避免了昂貴的優化過程,而依靠我們之前完成的工作來優化查詢。
When a query is executed that already has a valid plan in cache, that plan will be chosen, rather than going through the process of building a new one. This saves computing resources and speeds up query execution immensely. We’ll discuss plan reuse more in a future article when we tackle parameter sniffing.
當查詢已經在緩存中具有有效計劃的查詢執行時,将選擇該計劃,而不是執行建構新計劃的過程。 這樣可以節省計算資源并極大地加快查詢的執行速度。 在處理參數嗅探時,我們将在以後的文章中讨論計劃重用。
查詢優化中的常見主題 (Common Themes in Query Optimization)
With the introduction out of the way, let’s dive into optimization! The following is a list of the most common metrics that will assist in optimization. Once the basics are out of the way, we can use these basic processes to identify tricks, tips, and patterns in query structure that can be indicative of poor performance.
随着介紹的進行,讓我們開始進行優化! 以下是有助于優化的最常見名額清單。 一旦不了解基礎知識,我們就可以使用這些基本過程來識别查詢結構中的技巧,技巧和模式,這些技巧,技巧和模式可能表明性能不佳。
索引掃描 (Index Scans)
Data may be accessed from an index via either a scan or a seek. A seek is a targeted selection of rows from the table based on a (typically) narrow filter. A scan is when an entire index is searched to return the requested data. If a table contains a million rows, then a scan will need to traverse all million rows to service the query. A seek of the same table can traverse the index’s binary tree quickly to return only the data needed, without the need to inspect the entire table.
可以通過掃描或查找從索引通路資料。 搜尋是基于(通常)窄過濾器從表中選擇行的目标。 掃描是指搜尋整個索引以傳回所請求的資料。 如果一個表包含一百萬行,則掃描将需要周遊所有一百萬行以服務查詢。 對同一表的搜尋可以快速周遊索引的二叉樹,進而僅傳回所需的資料,而無需檢查整個表。
If there is a legitimate need to return a great deal of data from a table, then an index scan may be the correct operation. If we needed to return 950,000 rows from a million row table, then an index scan makes sense. If we only need to return 10 rows, then a seek would be far more efficient.
如果确實有必要從表中傳回大量資料,則索引掃描可能是正确的操作。 如果我們需要從一百萬行表中傳回950,000行,那麼索引掃描就很有意義。 如果我們隻需要傳回10行,那麼查找将更加有效。
Index scans are easy to spot in execution plans:
索引掃描很容易在執行計劃中發現:
SELECT
	*
FROM Sales.OrderTracking
INNER JOIN Sales.SalesOrderHeader
ON SalesOrderHeader.SalesOrderID = OrderTracking.SalesOrderID
INNER JOIN Sales.SalesOrderDetail
ON SalesOrderDetail.SalesOrderID = SalesOrderHeader.SalesOrderID
WHERE OrderTracking.EventDateTime = '2014-05-29 00:00:00';
We can quickly spot the index scan in the top-right corner of the execution plan. Consuming 90% of the resources of the query, and being labeled as a clustered index scan quickly lets us know what is going on here. STATISTICS IO also shows us a large number of reads against the OrderTracking table:
我們可以在執行計劃的右上角快速發現索引掃描。 消耗查詢的90%的資源,并被快速标記為聚集索引掃描,這使我們知道這裡發生了什麼。 STATISTICS IO還向我們顯示了對OrderTracking表的大量讀取:
Many solutions are available when we have identified an undesired index scan. Here is a quick list of some thoughts to consider when resolving an index scan problem:
當我們确定了不需要的索引掃描時,可以使用許多解決方案。 以下是解決索引掃描問題時要考慮的一些想法的快速清單:
-
- EventDateTime? EventDateTime上是否有索引?
-
-
Is this query executed often enough to warrant this change? Indexes improve read speeds on queries, but will reduce write speeds, so we should add them with caution.
是否經常執行此查詢以保證進行此更改? 索引可提高查詢的讀取速度,但會降低寫入速度,是以我們應謹慎添加它們。
-
-
-
Should we discuss this with those responsible for the app to determine a better way to search for this data?
我們是否應該與負責該應用程式的人員讨論此問題,以便确定搜尋此資料的更好方法?
-
- EventDataTime in this example), then there may be some other shenanigans here that require our attention! EventDataTime ),則此處可能還有其他需要我們注意的惡作劇!
-
- EventDateTIme happens to equal “5-29-2014” in every row in Sales.OrderTracking的每一行中Sales.OrderTracking, then a scan is expected. Similarly, if we were performing a fuzzy string search, an index scan would be difficult to avoid without implementing a Full-Text Index, or some similar feature. EventDateTIme恰好等于“ 5-29-2014”,則應該進行掃描。 同樣,如果執行模糊字元串搜尋,那麼如果不實施全文索引或某些類似功能,就很難避免索引掃描。
As we walk through more examples, we’ll find a wide variety of other ways to identify and resolve undesired index scans.
當我們周遊更多示例時,我們将找到多種其他方法來辨別和解決不希望的索引掃描。
聯接和WHERE子句周圍的函數 (Functions Wrapped Around Joins and WHERE Clauses)
A theme in optimization is a constant focus on joins and the WHERE clause. Since IO is generally our biggest cost, and these are the query components that can limit IO the most, we’ll often find our worst offenders here. The faster we can slice down our data set to only the rows we need, the more efficient query execution will be!
優化的主題是不斷關注聯接和WHERE子句。 由于IO通常是我們最大的成本,而這些查詢元件可能會最大程度地限制IO,是以我們經常在這裡找到最糟糕的違規者。 我們将資料集切成僅需要的行的速度越快,查詢執行的效率就越高!
When evaluating a WHERE clause, any expressions involved need to be resolved prior to returning our data. If a column contains functions around it, such as DATEPART, SUBSTRING, or CONVERT, then these functions will also need to be resolved. If the function must be evaluated prior to execution to determine a result set, then the entirety of the data set will need to be scanned to complete that evaluation.
在評估WHERE子句時,需要先解決所有涉及的表達式,然後再傳回我們的資料。 如果列周圍包含函數,例如DATEPART,SUBSTRING或CONVERT,則這些函數也需要解析。 如果必須在執行之前評估功能以确定結果集,則将需要掃描整個資料集以完成該評估。
Consider the following query:
考慮以下查詢:
SELECT
	Person.BusinessEntityID,
	Person.FirstName,
	Person.LastName,
	Person.MiddleName
FROM Person.Person
WHERE LEFT(Person.LastName, 3) = 'For';
This will return any rows from Person.Person that have a last name beginning in “For”. Here is how the query performs:
這将傳回Person.Person中姓氏以“ For”開頭的所有行。 查詢的執行方式如下:
Despite only returning 4 rows, the entire index was scanned to return our data. The reason for this behavior is the use of LEFT on Person.LastName. While our query is logically correct and will return the data we want, SQL Server will need to evaluate LEFT against every row in the table before being able to determine which rows fit the filter. This forces an index scan, but luckily one that can be avoided!
盡管僅傳回4行,但整個索引仍被掃描以傳回我們的資料。 此行為的原因是對Person.LastName使用LEFT。 雖然我們的查詢在邏輯上是正确的,并且将傳回我們想要的資料,但是SQL Server将需要針對表中的每一行評估LEFT,然後才能确定哪些行适合過濾器。 這會強制進行索引掃描,但幸運的是可以避免!
When faced with functions in the WHERE clause or in a join, consider ways to move the function onto the scalar variable instead. Also think of ways to rewrite the query in such a way that the table columns can be left clean (that is: no functions attached to them!)
當在WHERE子句或聯接中遇到函數時,請考慮将函數移至标量變量的方法。 還請考慮以可以使表列保持整潔的方式重寫查詢的方法(即:沒有附加的函數!)
The query above can be rewritten to do just this:
上面的查詢可以重寫為執行以下操作:
SELECT
	Person.BusinessEntityID,
	Person.FirstName,
	Person.LastName,
	Person.MiddleName
FROM Person.Person
WHERE Person.LastName LIKE 'For%';
By using LIKE and shifting the wildcard logic into the string literal, we have cleaned up the LastName column, which will allow SQL Server full access to seek indexes against it. Here is the performance we see on the rewritten version:
通過使用LIKE并将通配符邏輯轉換為字元串文字,我們清理了LastName列,該列将允許SQL Server完全通路權限來為其尋找索引。 這是我們在重寫版本上看到的性能:
The relatively minor query tweak we made allowed the query optimizer to utilize an index seek and pull the data we wanted with only 2 logical reads, instead of 117.
我們進行的相對較小的查詢調整允許查詢優化器利用索引查找并僅通過2個邏輯讀取(而不是117個)讀取所需的資料。
The theme of this optimization technique is to ensure that columns are left clean! When writing queries, feel free to put complex string/date/numeric logic onto scalar variables or parameters, but not on columns. If you are troubleshooting a poorly performing query and notice functions (system or user-defined) wrapped around column names, then begin thinking of ways to push those functions off into other scalar parts of the query. This will allow SQL Server to seek indexes, rather than scan, and therefore make the most efficient decisions possible when executing the query!
此優化技術的主題是確定列保持幹淨! 編寫查詢時,可以将複雜的字元串/日期/數字邏輯放到标量變量或參數上,但不能放到列上。 如果要對性能不佳的查詢和通知功能(系統或使用者定義的)包裹在列名周圍進行故障排除,請開始考慮将這些功能推入查詢的其他标量部分的方法。 這将使SQL Server可以查找索引,而不是掃描索引,是以可以在執行查詢時做出最有效的決策!
隐式轉換 (Implicit Conversions)
Earlier, we demonstrated how wrapping functions around columns can result in unintended table scans, reducing query performance and increasing latency. Implicit conversions behave the exact same way but are far more hidden from plain sight.
之前,我們示範了如何在列周圍包裝功能會導緻意外的表掃描,進而降低查詢性能并增加延遲。 隐式轉換的行為方式完全相同,但對普通人而言隐藏得多。
When SQL Server compares any values, it needs to reconcile data types. All data types are assigned a precedence in SQL Server and whichever is of the lower precedence will be automatically converted to the data type of higher precedence. For more info on operator precedence, see the link at the end of this article containing the complete list.
當SQL Server比較任何值時,它需要協調資料類型。 在SQL Server中為所有資料類型配置設定了優先級,并且優先級較低的那個将自動轉換為優先級較高的資料類型。 有關運算符優先級的更多資訊,請參見本文末尾的包含完整清單的連結。
Some conversions can occur seamlessly, without any performance impact. For example, a VARCHAR(50) and VARCHAR(MAX) can be compared no problem. Similarly, a TINYINT and BIGINT, DATE and DATETIME, or TIME and a VARCHAR representation of a TIME type. Not all data types can be compared automatically, though.
某些轉換可以無縫進行,而不會影響性能。 例如,可以比較VARCHAR(50)和VARCHAR(MAX)。 同樣,TINYINT和BIGINT,DATE和DATETIME或TIME以及TIME類型的VARCHAR表示形式。 但是,并非所有資料類型都可以自動比較。
Consider the following SELECT query, which is filtered against an indexed column:
考慮以下SELECT查詢,該查詢是根據索引列進行過濾的:
SELECT
	EMP.BusinessEntityID,
	EMP.LoginID,
	EMP.JobTitle
FROM HumanResources.Employee EMP
WHERE EMP.NationalIDNumber = 658797903;
A quick glance and we assume that this query will result in an index seek and return data to us quite efficiently. Here is the resulting performance:
快速浏覽一下,我們假設此查詢将導緻索引查找并将資料非常有效地傳回給我們。 這是産生的性能:
Despite only looking for a single row against an indexed column, we got a table scan for our efforts. What happened? We get a hint from the execution plan in the yellow exclamation mark over the SELECT operation:
盡管隻針對索引列隻查找一行,但是我們還是進行了表格掃描以查找我們的工作。 發生了什麼? 我們從執行計劃中的SELECT操作的黃色感歎号中得到了提示:
Hovering over the operator reveals a CONVERT_IMPLICIT warning. Whenever we see this, it is an indication that we are comparing two data types that are different enough from each other that they cannot be automatically converted. Instead, SQL Server converts every single value in the table prior to applying the filter.
将滑鼠懸停在運算符上會顯示CONVERT_IMPLICIT警告。 每當我們看到這種情況時,就表明我們正在比較兩個彼此完全不同以至于無法自動轉換的資料類型。 而是,SQL Server在應用篩選器之前轉換表中的每個單個值。
When we hover over the NationalIDNumber column in SSMS, we can confirm that it is in fact an NVARCHAR(15). The value we are comparing it to is a numeric. The solution to this problem is very similar to when we had a function on a column: Move the conversion over to the scalar value, instead of the column. In this case, we would change the scalar value 658797903 to the string representation, ‘658797903’:
當我們将滑鼠懸停在SSMS中的NationalIDNumber列上時,我們可以确認它實際上是NVARCHAR(15)。 我們要與之比較的值是一個數字。 此問題的解決方案與在列上具有函數時非常相似:将轉換移至标量值而不是列。 在這種情況下,我們将标量值658797903更改為字元串表示形式'658797903':
SELECT
	EMP.BusinessEntityID,
	EMP.LoginID,
	EMP.JobTitle
FROM HumanResources.Employee EMP
WHERE EMP.NationalIDNumber = '658797903'
This simple change will completely alter how the query optimizer handles the query:
這個簡單的更改将完全改變查詢優化器處理查詢的方式:
The result is an index seek instead of a scan, less IO, and the implicit conversion warning is gone from our execution plan.
結果是索引查找而不是掃描,進而減少了IO,并且隐式轉換警告已從我們的執行計劃中删除。
Implicit conversions are easy to spot as you’ll get a prominent warning from SQL Server in the execution plan whenever it happens. Once you’ve been tipped off to this problem, you can check the data types of the columns indicated in the warning and resolve the issue.
隐式轉換很容易發現,因為您會在執行計劃中從SQL Server得到明顯的警告。 解決此問題後,可以檢查警告中訓示的列的資料類型并解決問題。
結論 (Conclusion)
Query optimization is a huge topic that can easily become overwhelming without a good dose of focus. The best way to approach a performance problem is to find specific areas of focus that are most likely the cause of latency. A stored procedure could be 10,000 lines long, but only a single line needs to be addressed to resolve the problem. In these scenarios, finding the suspicious, high-cost, high resource-consuming parts of a script can quickly narrow down the search and allow us to solve a problem rather than hunt for it.
查詢優化是一個巨大的主題,如果沒有足夠的重點,很容易變得不知所措。 解決性能問題的最佳方法是找到最有可能導緻延遲的特定關注領域。 存儲過程的長度可能為10,000行,但是隻需一行即可解決該問題。 在這些情況下,找到腳本中可疑,高成本,高資源消耗的部分可以Swift縮小搜尋範圍,并允許我們解決問題而不是尋找問題。
The information in this article should provide a good starting point to tackling latency and performance problems. Query optimization sometimes requires additional resources, such as adding a new index but often can end up as a freebie. When we can improve performance solely by rewriting a query, we reduce resource consumption at no cost (aside from our time). As a result, query optimization can be a direct source of cost-savings! In addition to saving money, resources, and the sanity of those waiting for queries to complete, there is a great deal of satisfaction to be gained by improving a process at no further cost to anyone else.
本文中的資訊應為解決延遲和性能問題提供一個很好的起點。 查詢優化有時需要額外的資源,例如添加新索引,但通常最終可以成為免費贈品。 當我們僅通過重寫查詢就可以提高性能時,我們會免費(除了我們的時間)減少資源消耗。 結果,查詢優化可以直接節省成本! 除了節省金錢,資源和等待查詢完成的人員的理智之外,通過改進流程也可以獲得很多滿足,而其他任何人都無需承擔任何其他費用。
Thanks for reading, and let’s keep on making things go faster!
感謝您的閱讀,讓我們繼續前進!
目錄 (Table of contents)
| Query optimization techniques in SQL Server: the basics |
| Query optimization techniques in SQL Server: tips and tricks |
| Query optimization techniques in SQL Server: Database Design and Architecture |
| Query Optimization Techniques in SQL Server: Parameter Sniffing |
| SQL Server中的查詢優化技術:基礎 |
| SQL Server中的查詢優化技術:提示和技巧 |
| SQL Server中的查詢優化技術:資料庫設計和體系結構 |
| SQL Server中的查詢優化技術:參數嗅探 |
翻譯自: https://www.sqlshack.com/query-optimization-techniques-in-sql-server-the-basics/