<!DOCTYPE html>
<html >
<head>
<meta charset="utf-8">
<meta name="description" content="ECharts">
<title>Memory page</title>
<script type="text/javascript" src="js/jquery-1.8.3.js"></script>
<script type="text/javascript" src="js/echarts2/esl.js"></script>
<script type="text/javascript" src="js/echarts2/echarts.js"></script>
</head>
<body>
<!-- 為ECharts準備一個具備大小(寬高)的Dom -->
<div id="main" style="height:400px ; width: 90%;"></div>
<script type="text/javascript" >
var myChart;
var echarts;
var domain=document.getElementById('main');
// 按需加載
require(
[
'echarts',
'echarts/chart/line',
'echarts/chart/bar'
],
DrawEChart
);
//建立ECharts圖表方法
function DrawEChart(ec) {
echarts=ec;
myChart = echarts.init(domain);
myChart.showLoading({
text : "圖表資料正在努力加載...",
effect :'whirling',//'spin' | 'bar' | 'ring' | 'whirling' | 'dynamicLine' | 'bubble'
textStyle : {fontSize : 20 }
});
//定義圖表options
var option = {
title : {
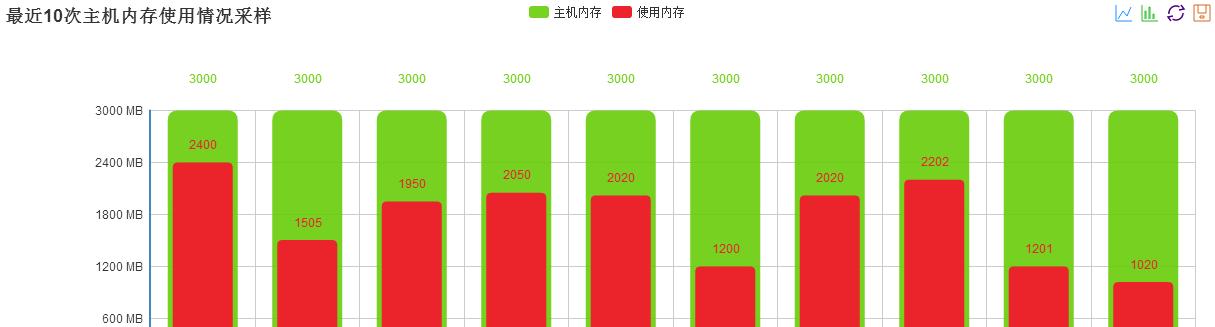
text: '最近10次主機記憶體使用情況采樣'
},
tooltip : {
trigger: 'axis'
},
legend: {
data:[
'主機記憶體',
'使用記憶體'
]
},
toolbox: {
show : true,
feature : {
//mark : {show: true},
//dataView : {show: true, readOnly: false},
magicType : {show: true, type: ['line', 'bar']},
restore : {show: true},
saveAsImage : {show: true}
}
},
calculable : true,
grid: {x :150 , y: 110 ,x2:20 , y2:30},
xAxis : [
{
type : 'category',
data : ['時間1','時間2','時間3','時間4','時間5','時間6','時間7','時間8','時間9','時間10']
},
{
type : 'category',
axisLine: {show:false}, axisTick: {show:false}, axisLabel: {show:false},
splitArea: {show:false}, splitLine: {show:false},
data : ['時間1','時間2','時間3','時間4','時間5','時間6','時間7','時間8','時間9','時間10']
}
],
yAxis : [
{
type : 'value',
axisLabel:{formatter:'{value} MB'}
}
],
series : [
{
name:'使用記憶體',
type:'bar',
barWidth: fixWidth(0.05),
itemStyle: {normal: {
borderRadius: 5 ,
color:'rgba(235,35,43,1)',
label:{show:true}}},
data:[2400,1505,1950,2050,2020,1200,2020,2202,1201,1020]
},
{
name:'主機記憶體',
type:'bar',
barWidth: fixWidth(0.06),
xAxisIndex:1,
itemStyle: {normal: {
borderRadius: 10 ,
color:'rgba(105,205,10,0.9)',
label:{show:true,formatter:function(a,b,c){return c>0 ? (c +'\n'):'';}}
}},
data:[3000,3000,3000,3000,3000,3000,3000,3000,3000,3000,3000]
}
]
};
setTimeout(function (){
myChart.setOption(option);
myChart.hideLoading();
},100);
}
</script>
<script>
function fixWidth(percent)
{
return document.body.clientWidth * percent ; //這裡你可以自己做調整
}
</script>
</body>
</html>
 Echarts 記憶體使用率(圖表覆寫,寬度百分比)
 ![實作電腦功能[圖]](data:image/gif;base64,R0lGODlhAQABAIAAAP///wAAACwAAAAAAQABAAACAkQBADs=)