這是一個簡單的詞頻統計系統,用javaWeb編寫的。涉及到java的檔案上傳,EChart等技術。
這是我的第一篇部落格,說起來有些慚愧,作為一個程式猿竟然至今沒寫過一篇技術部落格。在這裡,先向讀到這篇部落格的讀者緻歉,原諒我粗糙的表達能力。
在讀研究所學生之前,“程式員”對我來說,隻是三個字的組合,我并不了解程式員的世界,也不知道一個程式員的基本素養(這個詞是從亮哥那聽來的,但是是從楊老師那了解的)。在這裡,我要向我的導師--楊貴福老師表示深深的感謝,他教會了我許多作為一個程式員應有的工作的态度以及責任。
接下來談談我第一次上我導師的課的感受。我現在是研二,兩年來我從沒聽過我的導師上的課。上周五是我第一次聽他上課,第一感覺就是風格迥異。他上課的風格和我以前的老師的style完全不一樣。不按照書本上的來(當然研究所學生也沒有特定的課本),完全根據自己從事工程師多年的經驗來給我們講解軟體工程。第二感覺就是内容充實、豐富。但是,可能對于初學者來說有點壓力過大。在這次課上,我聽到一個非常引起我注意的問題:“教師是服務行業嗎?”。楊老師給出的答案是:“教師不是服務行業”。的确,現在大多數學生都認為教師是服務行業。“我”交了學費,學校提供這一服務。“我”是顧客,“我”就是上帝。“我”可以對你提供的服務進行評論,“我”也可以選擇是否接受你的服務。我覺得正是由于這種想法,才組織了我們的求知欲。這裡就不再贅述這一話題。
進入主題。下面談談我對詞頻統計系統的看法。我的方案是:源檔案經過一個引擎解析出這個檔案有多少個不同的單詞以及每個單詞出現的次數,最後顯示在頻幕上。
主要技術包括:1.檔案的上傳。檔案上傳有很多方式,這裡我選擇的是SmartUpload.jar。個人覺得簡單好用。
2.單詞的分割。涉及到标點符号的處理。我在網上看到一個很好的處理方案。采用java正則替換标點。參考位址:http://blog.csdn.net/wangran51/article/details/7764256
3.資料的顯示。資料的顯示有很多種方案。比如文字,圖表,表格等。這裡我用的是百度的産品EChart.是免費的,而且官網有纖細的教程。參考位址:http://echarts.baidu.com/index.html
index.jsp代碼如下:
1 <div align="center" style="margin-top:50px;">
2   <form action="servlet/fileupload_servlet" method="post" enctype="multipart/form-data">
3     <input type="file" name="file_name" id="file_name" accept=".txt" style="height: 40px; width: 500px; border: 1px solid;">
4     <input type="submit" value="檢索" style="height: 40px;">
5   </form>
6   </div>
fileupload_servlet代碼如下:
1 public void doPost(HttpServletRequest request, HttpServletResponse response)
 2             throws ServletException, IOException {
 3
 4         request.setCharacterEncoding("GBK");
 5         //設定檔案儲存的路徑
 6         Date currentData = new Date();
 7         SimpleDateFormat sdf = new SimpleDateFormat("yyyyMMdd");
 8         String cal = sdf.format(currentData);
 9         String filePath = getServletContext().getRealPath("/") + "upload/"+cal;
10
11         //初始化SmartUpload
12         SmartUpload upload = new SmartUpload();
13         upload.initialize(this.getServletConfig(), request, response);
14         @SuppressWarnings("unused")
15         int count = 0;
16         com.jspsmart.upload.File tempFile = null;
17         //開始上傳
18         try {
19             upload.setMaxFileSize(10*1024*1024);//設定檔案大小的上限10M
20             upload.setAllowedFilesList("txt");//設定允許上傳的檔案格式,多個用,分開
21             upload.upload();//上傳檔案
22
23             // 如果檔案夾不存在 則建立這個檔案夾
24             File file = new File(filePath);
25             if (!file.exists()) {
26                 file.mkdir();
27             }
28             count = upload.save(filePath);//儲存檔案到指定路徑
29
30             for (int i = 0; i < upload.getFiles().getCount(); i++) {
31                 tempFile = upload.getFiles().getFile(i);//讀取剛上傳的檔案
32 //                File file1=new File(filePath+tempFile.getFileName());
33 //                System.out.println("-------------------------------------------------");
34 //                System.out.println("表單項名稱:" + tempFile.getFieldName());
35 //                System.out.println("檔案名:" + tempFile.getFileName());
36 //                System.out.println("檔案長度:" + tempFile.getSize());
37 //                System.out.println("檔案擴充名:" + tempFile.getFileExt());
38 //                System.out.println("檔案全名:" + tempFile.getFilePathName());
39             }
40         } catch (SmartUploadException e) {
41             e.printStackTrace();
42         } catch (SecurityException e) {
43             System.out.println("格式不符合");
44         }
45 //        System.out.println(count);
46
47         //////////////////////////////讀取檔案///////////////////////////////
48
49         Map<String,Integer> map = FileUtil.readtxtFile(filePath+"/"+tempFile.getFileName());
50         System.out.println(map.toString());
51
52         request.getSession().setAttribute("data", map);
53         String path = request.getContextPath();
54         response.sendRedirect(path+"/Chart.jsp");
55     }
FileUtil.java代碼如下:
package util;

import java.io.BufferedReader;
import java.io.File;
import java.io.FileInputStream;
import java.io.FileNotFoundException;
import java.io.IOException;
import java.io.InputStreamReader;
import java.io.UnsupportedEncodingException;
import java.util.HashMap;
import java.util.Map;

public class FileUtil {

    /***
     * 讀取檔案,解析出單詞,并統計單詞數量
     * @param filePath
     * 檔案路徑
     * @return
     * 傳回Map對象,key是單詞,value對應單詞出現的次數
     */
    public static Map<String,Integer> readtxtFile(String filePath) {
        Map<String, Integer> index_map = new HashMap<String, Integer>();
        BufferedReader reader = null;
        File file = new File(filePath);
        try {
            FileInputStream in = new FileInputStream(file);
            reader = new BufferedReader(new InputStreamReader(in, "UTF-8"));
            String lineText = "";
            while((lineText=reader.readLine())!= null) {
                lineText = lineText.replaceAll("\\p{Punct}", " ").trim();//去除标點符号
//                lineText = lineText.replaceAll("\\pP", " ").trim();
                System.out.println(lineText);

                String[] lineArray = lineText.split(" ");

                for(String word:lineArray) {
                    word = word.toLowerCase().trim();
                    if(word.length()>0)
                        if(index_map.containsKey(word)) {
                            int value = index_map.get(word)+1;
                            index_map.remove(word);
                            index_map.put(word, value);
                        }
                        else {
                            index_map.put(word, 1);
                        }
                }
            }
        } catch (FileNotFoundException e) {
            e.printStackTrace();
        } catch (UnsupportedEncodingException e) {
            e.printStackTrace();
        } catch (IOException e) {
            e.printStackTrace();
        } finally {
            try {
                reader.close();
            } catch (IOException e) {
                e.printStackTrace();
            }
        }
        return index_map;
    }
}
Chart.jsp代碼如下:
1 <%@ page language="java" import="java.util.*" pageEncoding="UTF-8"%>
2 <%
3 String path = request.getContextPath();
4 String basePath = request.getScheme()+"://"+request.getServerName()+":"+request.getServerPort()+path+"/";
5 %>
6
7 <!DOCTYPE HTML PUBLIC "-//W3C//DTD HTML 4.01 Transitional//EN">
8 <html>
9 <head>
10 <base href="<%=basePath%>">
11
12 <title>統計圖</title>
13 <meta http-equiv="pragma" content="no-cache">
14 <meta http-equiv="cache-control" content="no-cache">
15 <meta http-equiv="expires" content="0">
16 <meta http-equiv="keywords" content="keyword1,keyword2,keyword3">
17 <meta http-equiv="description" content="This is my page">
18
19 <!-- Step1 引入EChart.js -->
20 <script type="text/javascript" src="js/echarts.min.js"></script>
21 </head>
22
23 <body>
24 <!-- step2 建立一個圖表容器 -->
25 <div id="main" style="width: auto;height:500px;"></div>
26 <!-- step3 編寫js代碼 -->
27 <script type="text/javascript">
28 // 基于準備好的dom,初始化echarts執行個體
29 var myChart = echarts.init(document.getElementById('main'));
30
31 var x_data = new Array();//x軸資料
32 var y_data = new Array();//y軸資料
33 <%
34 //從背景讀取資料,複制給x_data和有y_data
35 Map<String,Integer> data_map = (Map<String,Integer>)request.getSession().getAttribute("data");
36 Set set = data_map.entrySet();
37 Iterator i = set.iterator();
38 int index = 0;
39 while(i.hasNext()){
40 Map.Entry<String, Integer> entry1=(Map.Entry<String, Integer>)i.next();
41 %>
42 x_data[<%=index%>] = '<%=entry1.getKey()%>';
43 y_data[<%=index%>] = <%=entry1.getValue().intValue()%>;
44 <%
45 index++;
46 }
47 %>
48
49 // 指定圖表的配置項和資料
50 var option = {
51 title: {
52 text: '詞頻統計圖'
53 },
54 tooltip: {},
55 legend: {
56 data:['詞頻']
57 },
58 xAxis: {
59 data: x_data
60 },
61 yAxis: {},
62 series: [{
63 name: '詞頻',
64 type: 'bar',
65 data: y_data
66 }]
67 };
68 myChart.setOption(option);
69 </script>
70 </body>
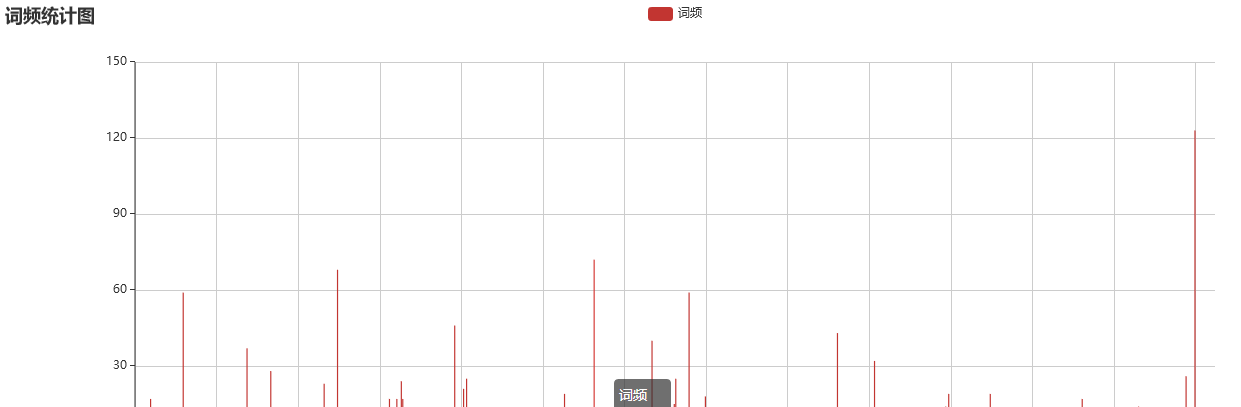
71 </html> 效果如下圖所示:
![Java小案例——随機數猜測随機數猜測[圖]](data:image/gif;base64,R0lGODlhAQABAIAAAP///wAAACwAAAAAAQABAAACAkQBADs=)