For project reason I have to measure the performance of OData service being accessed parallelly. And I plan to use the open source tool JMeter to generate a huge number of request in parallel and measure the average response time. Since I am a beginner for JMeter, I write down what I have learned into this blog.
I will continue to explorer the advanced feature of JMeter in my daily work.
(1) Download JMeter from its official website.
Go to the installation folder, add the following text in file \bin\user.properties:
httpclient4.retrycount=1
hc.parameters.file=hc.parameters
(2) Create a new test plan for example Customer_Query_OData_test, and right click on it and create a thread group from context menu.
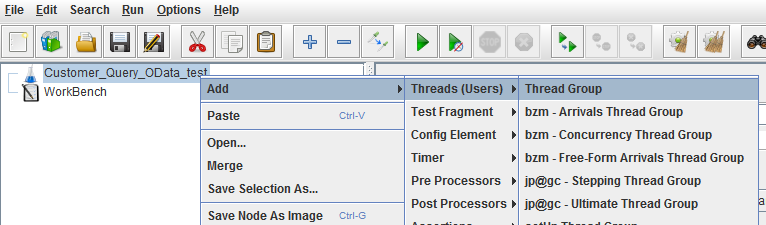
Below configuration means I would like to generate three request in parallel via three threads, each thread is executed only once. And there is no delay during the spawn of each threads ( Ramp-Up Period = 0 )

Create a new Http Request and maintain the following settings:
- Protocol: https
- Server name:
- Http request method: GET
- Http path: /sap/c4c/odata/v1/c4codata/AccountCollection/
-
Use KeepAlive: do NOT select this checkbox
In Parameter tab, maintain query option $search with value ‘Wang’
Switch to Advanced tab, choose “HttpClient4” from drop down list for Implementation, and maintain proxy server name and port number.
(3) Create a new HTTP Header Manager and specify the basic authentication header field and value.
(4) Create a listener for the test plan. In my test I simply choose the most simple one: View Results in Table.
Once done, start the test:
After the test is finished, double click on View Result Listener and the response time for each request and the average response time is displayed there:
Or you can use command line to achieve the same:
- -n: use non-GUI mode
- -t: specify which test plan you want to run
- -l: specify the path of output result file
And I have written a simple Java application to generate parallel request via multiple thread and the result measured in Java program is consistent with the one got from JMeter.
How to generate random query for each thread in JMeter
Suppose we would like each thread in JMeter to generate different customer query via OData with the format JerryTestCustomer_<1~100>, we can simply create a new user parameter:
- Parameter name: uuid
- Parameter value: use JMeter predefined function __Random to generate random number. So the value is: ${__Random(1,100)}
and in http request, just specify reference to this variable via ${uuid}:
So that in the end each thread will issue different query to OData service end point.
Further reading
- Consume standard C4C OData service via ABAP code
- Leverage C4C Odata notification to monitor C4C Opportunity change in CRM system
- OData Service backend implementation in C4C, CRM and S4 HANA
- JMeter beginner – how to use JMeter to measure performance of OData service accessed parallelly
- Regarding cookie manipulation in CL_HTTP_CLIENT to avoid CSRF token validation failure issue