mysql profile使用場景及方法
今天有客戶回報,同樣的SQL和同樣資料量的資料庫在RDS和自建庫上面,執行時間差異非常大,需要排查一下具體的原因,當時用了show profile給客戶說明了具體時間花費在哪一步。首先當然看下具體情況、資料量、索引、執行計劃等是否真的如客戶所說完全一緻,當然這不在我們這篇文檔的範圍内。
今天我們主要來講一下mysql show profile檢視SQL執行的時間到底去哪了。
準備工作
相關參數:
[profiling] 控制是否開啟profiling,值為bool,預設為off。
[profiling_history_size] 控制儲存的statement數量,預設為15,上限100,設定為0時關閉profiling。
文法:
SHOW PROFILE [type [, type] ... ]
[FOR QUERY n]
[LIMIT row_count [OFFSET offset]]
type: {
ALL
| BLOCK IO
| CONTEXT SWITCHES
| CPU
| IPC
| MEMORY
| PAGE FAULTS
| SOURCE
| SWAPS
}
使用profile之前,我們先要開啟profiling,預設該參數是關閉的,我們可以會話級别設定開啟來進行臨時測試。
| mysql> show variables like 'profiling'; | |
|---|---|
| Variable_name | Value |
| profiling | OFF |
1 row in set (0.00 sec)
mysql> set session profiling = 1;
執行SQL:
select * from class_a_score where id = 1;
| mysql> show variables like 'profiling_history_size'; | |
|---|---|
| profiling_history_size | 15 |
SHOW profiles 結果:show profiles 是檢視所有在history size(目前為15)的語句執行花費的時間和具體SQL語句。
| mysql> show profiles; | ||
|---|---|---|
| Query_ID | Duration | Query |
| 1 | 0.00034000 | explain select * from class_a_score where id = 1 |
| 2 | 0.00304225 | show variables like 'profiling_history_size' |
指定上面SQL_ID,檢視具體的query,每個階段所花費的時間。(注意,show profile隻顯示上一條SQL的結果)
這裡的status,就是show processlist中類似的結果。[可以另外加limit 和 offset 來控制輸出内容]
| mysql> show profile for query 1; | |
|---|---|
| Status | |
| starting | 0.000069 |
| checking permissions | 0.000011 |
| Opening tables | 0.000018 |
| init | 0.000027 |
| System lock | 0.000010 |
| optimizing | |
| statistics | 0.000041 |
| preparing | 0.000042 |
| explaining | |
| end | 0.000005 |
| query end | 0.000008 |
| closing tables | 0.000014 |
| freeing items | 0.000038 |
| cleaning up |
14 rows in set, 1 warning (0.01 sec)
| mysql> show profile for query 1 limit 1; | |
|---|---|
1 row in set, 1 warning (0.01 sec)
| mysql> show profile for query 1 limit 1 offset 2; | |
|---|---|
show profile 進階
另外可以加上type 檢視具體花費在CPU還是讀寫資料上等。
| mysql> show profile cpu; | |||
|---|---|---|---|
| CPU_user | CPU_system | ||
| 0.000065 | 0.000000 | 0.000053 | |
| 0.000019 | |||
| 0.000016 | |||
| 0.000006 | |||
| 0.000009 | |||
| executing | |||
| Sending data | 0.000482 | 0.000483 | |
| 0.000051 | 0.000060 | ||
15 rows in set, 1 warning (0.01 sec)
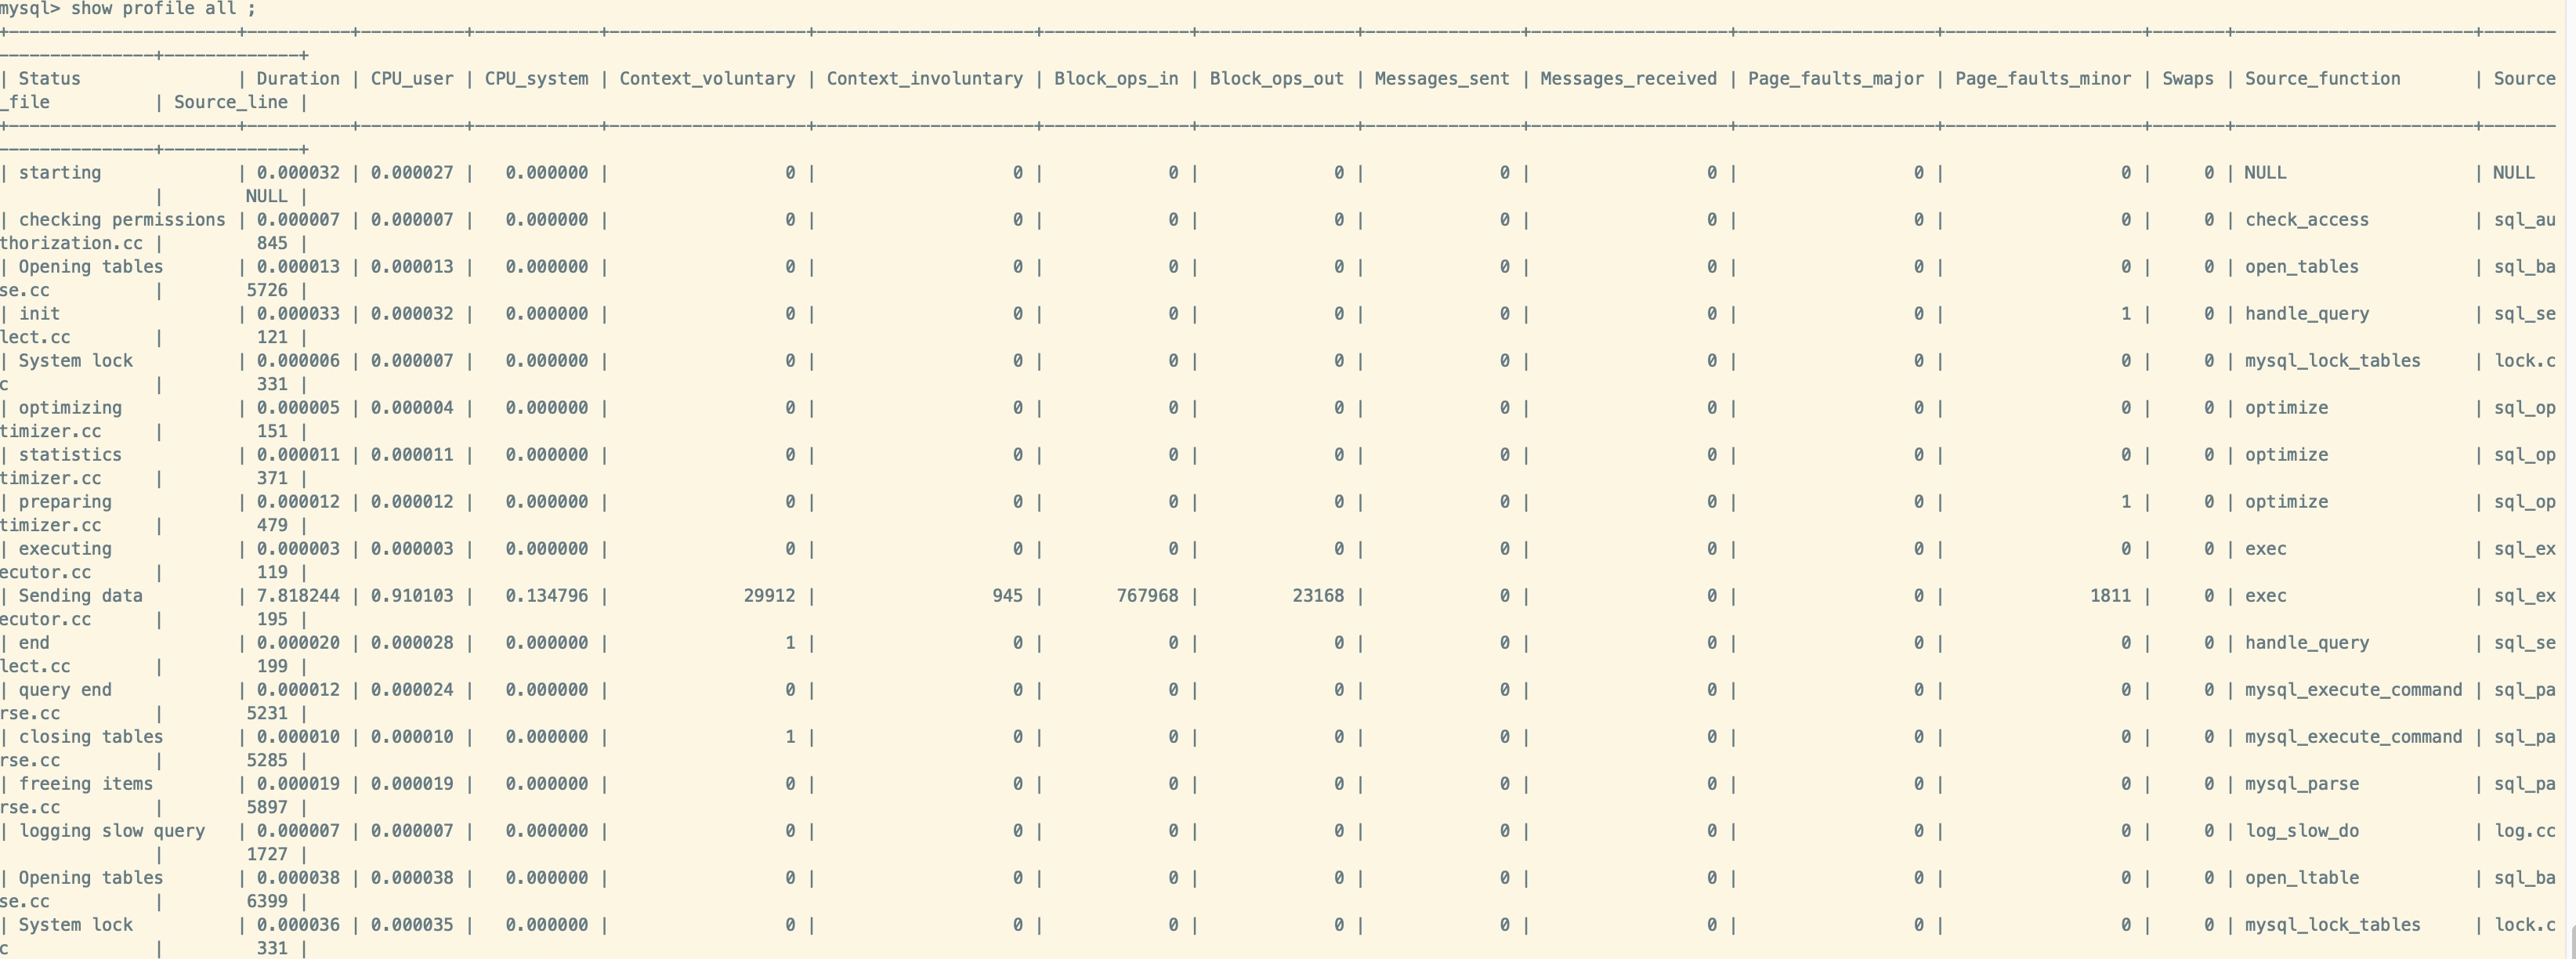
這個就是因為時間都花費在實體讀上面,導緻執行時間過長。
在performance_schema中的應用
因為官方文檔中指出,可能再不久将來會廢除show profile(因為确實有局限性,比如隻能在目前會話使用),目前已經支援使用performance_schema來檢視,如下是開啟過程:
1、檢視是否需要限制哪些前端線程會被記錄
SELECT * FROM performance_schema.setup_actors;
INSERT INTO performance_schema.setup_actors
(HOST,USER,ROLE,ENABLED,HISTORY)
VALUES('localhost','test_user','%','YES','YES');
2、開啟統計timer和eventUPDATE performance_schema.setup_instruments
SET ENABLED = 'YES', TIMED = 'YES'
WHERE (NAME LIKE '%statement/%' or NAME LIKE '%stage/%');
UPDATE performance_schema.setup_consumers
SET ENABLED = 'YES'
WHERE (NAME LIKE '%events_statements_%' or NAME LIKE '%events_stages_%');
3.查找出來event_id
SELECT EVENT_ID, TRUNCATE(TIMER_WAIT/1000000000000,6) as Duration, SQL_TEXT
FROM performance_schema.events_statements_history_long WHERE SQL_TEXT like '%sql_text%'
4.把上一步查出來event_id帶入
SELECT event_name AS Stage, TRUNCATE(TIMER_WAIT/1000000000000,6) AS Duration
FROM performance_schema.events_stages_history_long WHERE NESTING_EVENT_ID=<?>;
查考:
https://dev.mysql.com/doc/refman/5.6/en/show-profile.html![【MySQL資料庫】資料庫索引事務1.索引2.事務[圖]](data:image/gif;base64,R0lGODlhAQABAIAAAP///wAAACwAAAAAAQABAAACAkQBADs=)