簡介
Spring Boot 自帶監控功能 Actuator,可以幫助實作對程式内部運作情況監控,比如監控狀況、Bean加載情況、環境變量、日志資訊、線程資訊等。這一節結合 Prometheus 、Grafana 來更加直覺的展示這些資訊。
實驗
說明
| 服務名 | 位址 | 端口 |
|---|---|---|
| Prometheus | 172.16.2.101 | 9090 |
| Grafana | 3000 | |
| Spring Boot Demo | 172.16.2.204 | 8080 |
建立項目
建立用于測試的 Spring Boot 項目,主要代碼如下。
pom.xml
<dependency>
    <groupId>org.springframework.boot</groupId>
    <artifactId>spring-boot-starter-actuator</artifactId>
</dependency>
<dependency>
    <groupId>org.springframework.boot</groupId>
    <artifactId>spring-boot-starter-web</artifactId>
</dependency>
<dependency>
    <groupId>io.micrometer</groupId>
    <artifactId>micrometer-registry-prometheus</artifactId>
</dependency>

<dependency>
    <groupId>org.springframework.boot</groupId>
    <artifactId>spring-boot-starter-test</artifactId>
    <scope>test</scope>
</dependency>
application.yml
management:
  endpoints:
    web:
      exposure:
        include: '*'

  endpoint:
    health:
      show-details: always

  metrics:
    tags:
application: actuator-demo - management.endpoints.web.exposure.include:大多數actuator的端口都不會通過http公開,* 代表公開所有這些端點。對于生産環境,應該仔細選擇要公開的端點。
- management.metrics.tags.application:為應用設定 tag ,友善區分不同的應用。
啟動類
@SpringBootApplication
@RestController
public class SpringbootActuatorPrometheusDemoApplication {

    public static void main(String[] args) {
        SpringApplication.run(SpringbootActuatorPrometheusDemoApplication.class, args);
    }

    @RequestMapping(value = "/hello")
    public String  sayHello() {
        for (int i = 1 ; i <= 10 ; i++) {
            Thread t = new Thread(() -> {
                try {
                    Thread.sleep(5000);
                } catch (InterruptedException e) {
                    e.printStackTrace();
                }
            } , "HelloThread - " + i);
            t.start();
        }
        return "ok";
    }

    /**
    @Bean
    MeterRegistryCustomizer<MeterRegistry> metricsCommonTags() {
        return registry -> registry.config().commonTags("application", "springboot-actuator-prometheus-demo");
    }
    */

}
配置 Prometheus 和 Grafana
在 prometheus.yml 中添加針對該 Spring Boot 應用 的監控 job
- job_name: 'actuator-demo'
    metrics_path: '/prometheus'
    static_configs:
    - targets: ['172.16.2.204:8080']
運作 Prometheus 和 Grafana:
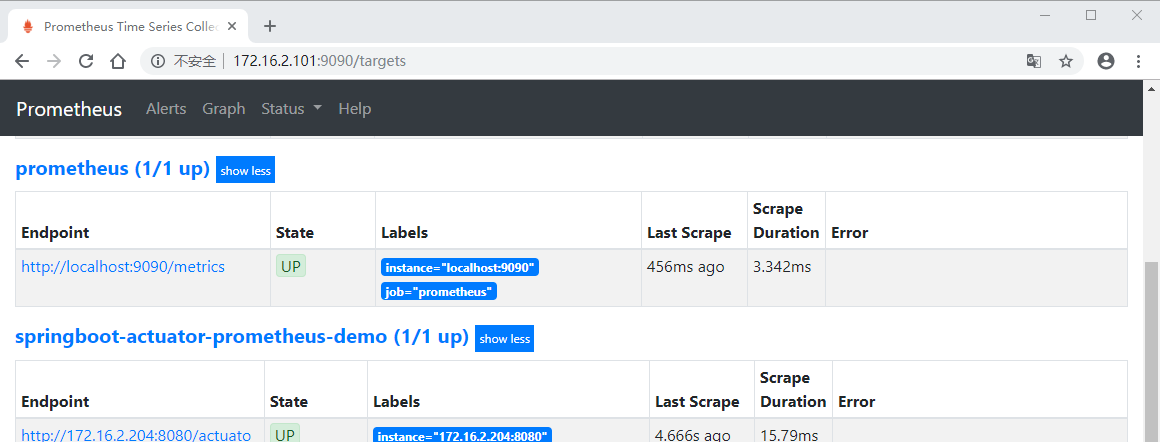
docker start prometheus grafana 通路 Prometheus UI
http://172.16.2.101:9090,檢視 targets ,可以看到 job 處于 UP 狀态,說明配置成功了。
Grafana UI
http://172.16.2.101:3000,通過Grafana的 + 圖示導入(Import) JVM (Micrometer) dashboard:
- grafana id = 4701
- 注意選中prometheus資料源
檢視JVM (Micormeter) dashboard:

可以看到應用的 JVM 的 堆棧、 線程、 IO 等等資訊。