文章系列連結
背景
針對實時采集的日志資料,如何從實時的日志中監控服務的穩定性;如何及時的将服務的異常通知到相關人員;如何根據一段時間内的時序日志消除抖動,更好的提高企業運維人員的效率。。。等等這些問題,都需要建立在如何快速且盡可能準确的發現異常。
日志服務團隊具備強大的日志采集功能,針對建立索引的日志進行快速的查詢和分析能力。基于此,我們團隊将時序資料分析功能整合到日志服務中去,結合更加強大的告警功能,幫助使用者根據自己的業務需求,快速的建構報警規則,提高效率。
名額說明
- 實驗對象
- 以SLS杭州Region的oplog為例
- 針對叢集穩定性的關注名額
- 最近1小時内請求狀态成功的平均延時
- 最近1小時内請求異常數量
異常檢測實際案例分析
一個平穩态例子
最近1小時内請求狀态成功的平均延遲
* and region: hangzhou |
select
    date_trunc('minute', __time__ - __time__ % 60) as t,
    count_if(Status=200) as succ,
    count_if(Status>200) as err,
    avg(Latency) as Latency
from log GROUP BY t order by t limit 10000 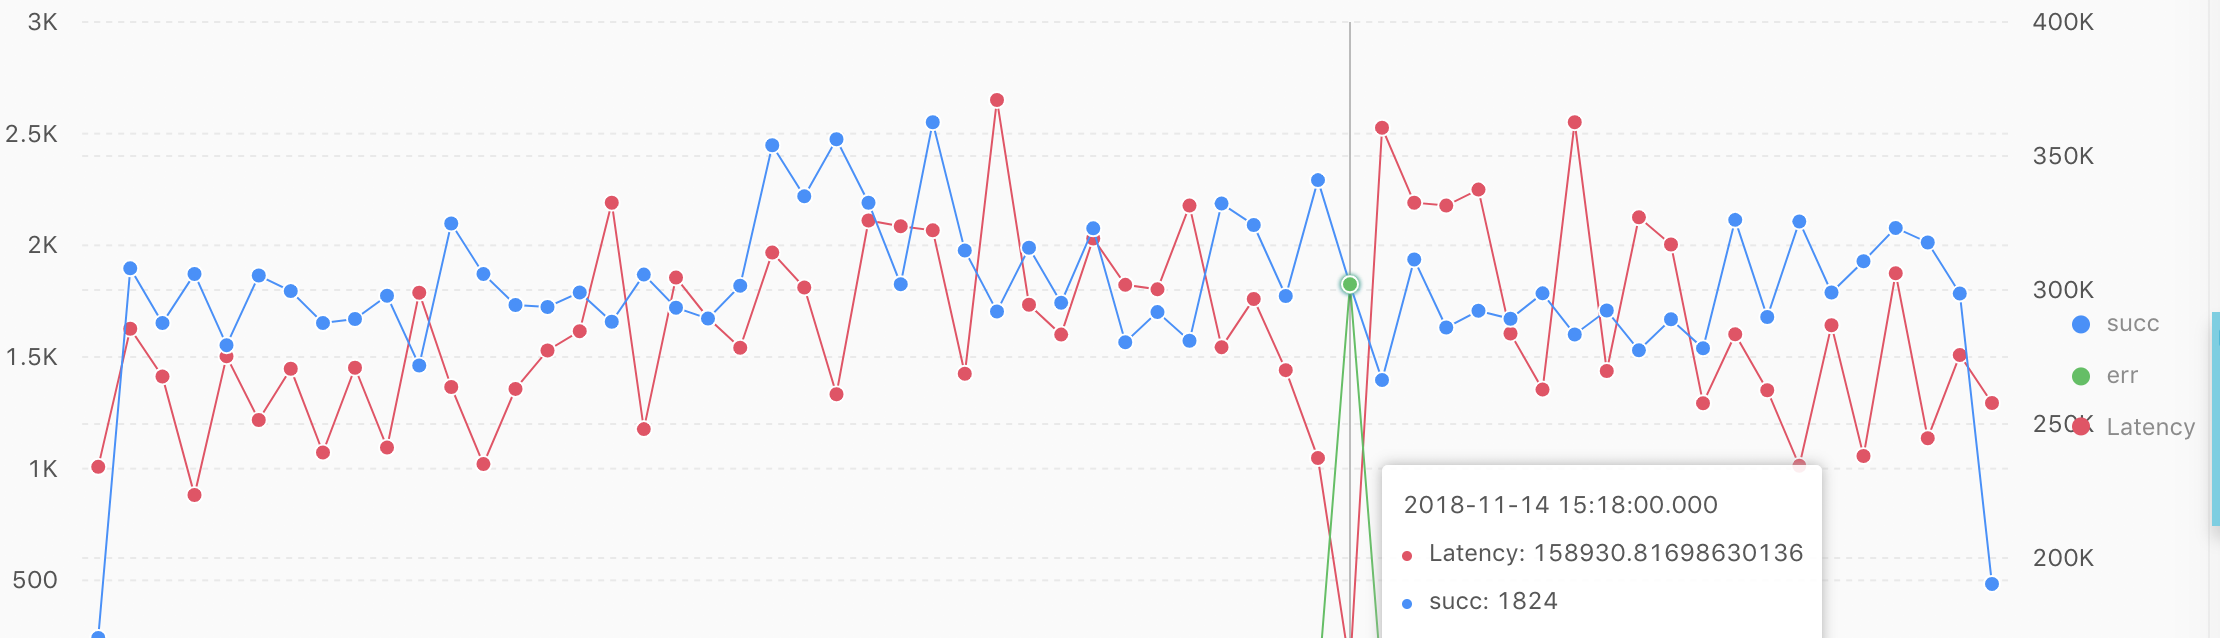
上圖中的藍色折線表示:每分鐘平均請求成功的量;綠色折線表示:每分鐘平均請求失敗的量;紅色的折線表示:每分鐘平均請求的延遲。通過上圖中的曲線可知,針對succ或這err這兩個名額進行判斷,卻不能得到很好的判斷,是以,将上述名額綜合考慮一下,得到一個異常占比名額。
* and region: hangzhou |
select
    time,
    err*1.0 / (succ + err) as ratio
from (
    select
        __time__ - __time__ % 30 as time,
        count_if(Status > 200) as err,
        count_if(Status=200) as succ
from log GROUP BY time ) limit 2000 
上圖中表示每分鐘$\frac{err}{succ + err}$的統計結果圖,可以真實上述曲線進行時序模組化,自動發現異常。具體的操作如下:
* and region: hangzhou |
select
    ts_predicate_arma(time, ratio, 5, 1, 1, 1, 'avg')
from (
    select
        time,
        err*1.0 / (succ + err) as ratio
    from (
        select
            __time__ - __time__ % 30 as time,
            count_if(Status > 200) as err,
            count_if(Status=200) as succ
from log GROUP BY time order by time) ) limit 2000 上圖表示使用ts_predict_arma函數,對時序ratio 曲線建立時序統計模型 arma(p=5,q=1) ,并利用SLS(日志服務)中内置的異常檢測政策,得到的檢測結果。其中藍色線表示實際的 ratio 時序狀态,紅色曲線表示針對曆史資料學習得到的有效的預測曲線,淺綠色的區域表示有效的預測置信區間,紅色的空心點表示發生異常的時間點。
一個抖動較大例子
針對杭州彈内叢集該統計名額的狀态
* and region: hangzhou_corp |
select
    time,
    err*1.0 / (succ + err) as ratio
from (
    select
        __time__ - __time__ % 30 as time,
        count_if(Status > 200) as err,
        count_if(Status=200) as succ
from log GROUP BY time order by time ) limit 2000 上圖中 $\frac{err}{err + succ}$ 的抖動較為異常,分析下日志,大部分是因為請求時産生了400或者401的錯誤(用去請求的參數不對、或者是權限異常、或是心跳部分異常)。這種折線,可以使用時序統計模型麼?來來來,具體的操作如下:
* and region: hangzhou_corp |
select
    ts_predicate_arma(time, ratio, 5, 1, 1, 1, 'avg')
from (
    select
        time,
        err*1.0 / (succ + err) as ratio
    from (
        select
            __time__ - __time__ % 30 as time,
            count_if(Status > 200) as err,
            count_if(Status=200) as succ
from log GROUP BY time )) limit 2000 上圖中的結果是使用 ts_predict_arma 函數,使用 arma(p=5,q=1) 的參數進行學習,得到上圖的曲線,其中藍色折線表示:原始的觀測序列,紅色折線表示:時序模型的預測曲線,綠色區域表示可靠的緻信區間。
估計有的同學會有如下問題?
- 為何紅色折線與藍色折線抖動的幅度差距有點大呢?
- 為何藍色折線超出了綠色區域,但是卻沒有被标記為異常點呢?
疑問說明?️?️?️
内部在進行時序模組化之前,預先對原始資料進行一個平滑操作,該操作是對調用方是透明的,具體的結果如下:
* and region: hangzhou_corp |
select
    ts_smooth_fir(time, ratio, 'rectangle', 5, 1, 'avg')
from (
    select
        time,
        err*1.0 / (succ + err) as ratio
    from (
        select
            __time__ - __time__ % 30 as time,
            count_if(Status > 200) as err,
            count_if(Status=200) as succ
from log GROUP BY time order by time )) limit 2000 這時您再看下是不是就相似了很多了。
-
實際值超出了置信區間,卻沒有标記為異常點,卻是為何???
日志服務(SLS)内部采取多種政策對異常點進行檢測,盡可能的準确率、降低誤報率。算法的具體原理原理說明型文章
。對此感興趣的同學可以 釘釘:悟冥。
設定報警執行個體分析
時序函數有何不同之處??
- 标準的SQL函數,需要針對指定的字段進行查詢和輸出,一般格式如下:
select a, b, c from table; ===> a | b | c --------- 1 | 2 | 4 3 | 2 | 1 1 | 3 | 2 2 | 6 | 4 - SLS針對時序函數提供了内置展開操作(這裡需要重點感謝下 @馬雲雷 大神!),得到的結果如下:
select ts_predict_arma() from table;
===>
unixtime | src | pred | upper | lower | prob
---------------------------------------------
1.0      | 1.0 | 1.0  | 1.2   | 0.75  | 0.0
2.0      | 1.0 | 1.0  | 1.2   | 0.75  | 0.0
說明: 針對時序函數,我們提供了一套原生接口,可以按照一定的格式傳回一個元素,使用者需要針對需要自定展開操作,由于單節點放回容量有限,若使用者的請求傳回結果過大,超過了單節點容量限制,則不能成功傳回。
使用異常檢測函數進行報警
- 使用原生函數擷取結果
* and not Status:200 and region: hangzhou |
select
    ts_predicate_arma(time, Latency, 5, 1, 1, 1, 'avg') as key
from  (
    select
        __time__ - __time__ % 30 as time,
        count_if(Latency > 50000000) + 1 as Latency
from log GROUP BY time) 上述結果就是一個二維數組的結構,需要手動進行展開操作
- 手動展開操作
* and not Status:200 and region: hangzhou |
select
        key1[1] as stamp,
        key1[2] as src,
        key1[3] as pred,
        key1[4] as up,
        key1[5] as low,
        key1[6] as prob
from  (
    select
        ts_predicate_arma(time, Latency, 5, 1, 1, 1, 'avg') as key
    from  (
        select
            __time__ - __time__ % 30 as time,
            count_if(Latency > 50000000) + 1 as Latency
from log GROUP BY time)), unnest(key) as t(key1) - 我們不關心預測,隻關心最近2分鐘的異常檢測的結果
- 去掉預測的資料
- 找到最近2分鐘的狀态
* and not Status:200 and region: hangzhou |
  select
      stamp, src, pred, up, low, prob
  from  (
      select
          key1[1] as stamp,
          key1[2] as src,
          key1[3] as pred,
          key1[4] as up,
          key1[5] as low,
          key1[6] as prob
      from  (
          select
              ts_predicate_arma(time, Latency, 5, 1, 1, 1, 'avg') as key
          from  (
              select
                  __time__ - __time__ % 30 as time,
                  count_if(Latency > 50000000) + 1 as Latency
              from log GROUP BY time)), unnest(key) as t(key1) )
where is_nan(src) = false order by stamp DESC limit 4 - 确定最近2分鐘内的是否有異常
* and not Status:200 and region: hangzhou |
  select
      sum(prob) as sumProb
  from  (
      select
          stamp, prob
      from (
          select
              key1[1] as stamp,
              key1[2] as src,
              key1[3] as pred,
              key1[4] as up,
              key1[5] as low,
              key1[6] as prob
          from (
              select
                  ts_predicate_arma(time, Latency, 5, 1, 1, 1, 'avg') as key
              from  (
                  select
                      __time__ - __time__ % 30 as time,
                      count_if(Latency > 50000000) + 1 as Latency
                  from log GROUP BY time)), unnest(key) as t(key1) )
                  where is_nan(src) = false order by stamp DESC limit 4)
最終将上述查詢作為一個告警的SQL,在日志服務的Web端,可以使用如下的操作。
具體的配置如下:
PS: 上述截圖還是舊版本的告警設定,新的告警系統功能強大,敬請期待哈!
Tips
- 一般情情況下,我就單獨針對告警設定一個儀表盤,将時序的告警規則嵌入在頁面中,針對現有的報警一目了然,我的具體截圖如下:
SLS機器學習最佳實戰:時序異常檢測和報警
硬廣時間
日志進階
阿裡雲日志服務針對日志提供了完整的解決方案,以下相關功能是日志進階的必備良藥:
- 機器學習文法與函數: https://help.aliyun.com/document_detail/93024.html
- 日志上下文查詢: https://help.aliyun.com/document_detail/48148.html
- 快速查詢: https://help.aliyun.com/document_detail/88985.html
- 實時分析: https://help.aliyun.com/document_detail/53608.html
- 快速分析: https://help.aliyun.com/document_detail/66275.html
- 基于日志設定告警: https://help.aliyun.com/document_detail/48162.html
- 配置大盤: https://help.aliyun.com/document_detail/69313.html
更多日志進階内容可以參考:
日志服務學習路徑。
聯系我們
糾錯或者幫助文檔以及最佳實踐貢獻,請聯系:悟冥
問題咨詢請加釘釘群: