一、架構圖
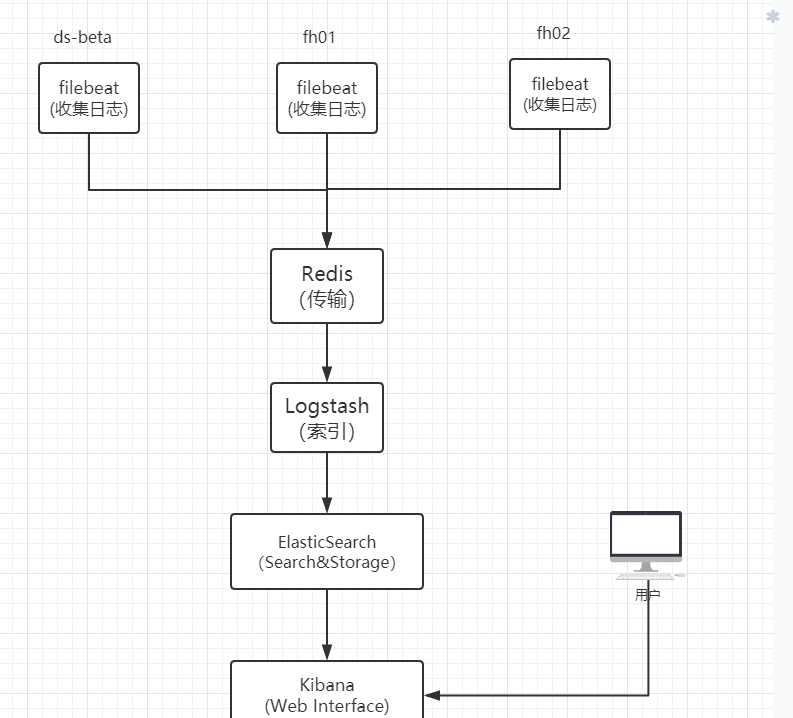
image.png
二、搭建
各個元件的軟體包,可以到Elastic Stack官網
下載下傳。本次搭建過程使用的是 6.3.1版本。
2.1 安裝配置ElasticSearch
elasticsearch和logstash都是java開發,運作需要java環境。是以需要先配置jdk
tar jdk-8u181-linux-x64.tar.gz -C /opt/
cd /opt && ln -sv jdk1.8.0_181 jdk

# 添加環境變量
vim /etc/profile
export JAVA_HOME=/opt/jdk
export JRE_HOME=/opt/jdk/jre
export PATH=$JAVA_HOME/bin:$JRE_HOME:/bin:$PATH

source /etc/profile
# 解壓
[root@monitor elk]# tar xvf elasticsearch-6.3.1.tar.gz
[root@monitor elk]# cd elasticsearch-6.3.1/
[root@monitor elasticsearch-6.3.1]# ls
bin  config  lib  LICENSE.txt  logs  modules  node2  node3  NOTICE.txt  plugins  README.textile

# 編輯配置檔案
[root@monitor elasticsearch-6.3.1]# grep "^[a-z]" config/elasticsearch.yml
cluster.name: fhw-es                    # elasticsearch叢集名稱
node.name: fhw-es-node-1                # es節點名稱
path.data: /data/elk/es/data            # es資料存儲目錄
path.logs: /data/elk/es/logs            # es日志存儲
network.host: 0.0.0.0
http.port: 9200                         # 監控的端口

# 啟動elasticsearch ,注意要用非root使用者啟動,這裡使用work使用者啟動它
nohup su work -c /home/work/lib/elk/es/bin/elasticsearch &


# 檢查elasticsearch是否正常啟動
[root@monitor work]# curl localhost:9200
{
  "name" : "fhw-es-node-1",
  "cluster_name" : "fhw-es",
  "cluster_uuid" : "WSP7F8NESFqxHqtvwlXZzw",
  "version" : {
    "number" : "6.3.1",
    "build_flavor" : "default",
    "build_type" : "tar",
    "build_hash" : "eb782d0",
    "build_date" : "2018-06-29T21:59:26.107521Z",
    "build_snapshot" : false,
    "lucene_version" : "7.3.1",
    "minimum_wire_compatibility_version" : "5.6.0",
    "minimum_index_compatibility_version" : "5.0.0"
  },
  "tagline" : "You Know, for Search"
}
    //出現以上結果,表明es啟動正常。
2.2 安裝配置Redis
# 下載下傳解壓
wget http://download.redis.io/releases/redis-4.0.10.tar.gz
tar xvf redis-4.0.10.tar.gz -C /home/work/lib/
cd /home/work/lib/redis-4.0.10/
make && make install
./utils/install_server.sh      # 這一步通過互動自定義資料、日志存放目錄

# 移動可執行檔案
cp /home/work/lib/redis-4.0.10/src/redis-server /home/work/lib/redis/bin/
cp /home/work/lib/redis-4.0.10/src/redis-cli /home/work/lib/redis/bin/
cp /home/work/lib/redis-4.0.10/src/redis-benchmark /home/work/lib/redis/bin/
cp /home/work/lib/redis-4.0.10/src/redis-check-* /home/work/lib/redis/bin/

# Redis安裝後的目錄結構
[root@monitor redis]# pwd
/home/work/lib/redis
[root@monitor redis]#
[root@monitor redis]# tree
.
├── bin
│   ├── redis-benchmark
│   ├── redis-check-aof
│   ├── redis-check-rdb
│   ├── redis-cli
│   └── redis-server
├── conf
│   └── 6379.conf
└── data
    └── 6379
        └── dump.rdb

4 directories, 7 files
編輯redis配置檔案
[root@monitor conf]# cd /home/work/lib/redis/conf

[root@monitor conf]# grep "^[a-z]" 6379.conf
bind 10.31.152.187 127.0.0.1
protected-mode yes
port 6379
tcp-backlog 511
timeout 0
tcp-keepalive 300
daemonize yes
supervised no
pidfile /var/run/redis_6379.pid
loglevel notice
logfile /home/work/logs/redis_6379.log
databases 16
always-show-logo yes
save 900 1
save 300 10
save 60 10000
stop-writes-on-bgsave-error yes
rdbcompression yes
rdbchecksum yes
dbfilename dump.rdb
dir /home/work/lib/redis/data/6379
slave-serve-stale-data yes
slave-read-only yes
repl-diskless-sync no
repl-diskless-sync-delay 5
repl-disable-tcp-nodelay no
slave-priority 100
lazyfree-lazy-eviction no
lazyfree-lazy-expire no
lazyfree-lazy-server-del no
slave-lazy-flush no
appendonly no
appendfilename "appendonly.aof"
appendfsync everysec
no-appendfsync-on-rewrite no
auto-aof-rewrite-percentage 100
auto-aof-rewrite-min-size 64mb
aof-load-truncated yes
aof-use-rdb-preamble no
lua-time-limit 5000
slowlog-log-slower-than 10000
slowlog-max-len 128
latency-monitor-threshold 0
notify-keyspace-events ""
hash-max-ziplist-entries 512
hash-max-ziplist-value 64
list-max-ziplist-size -2
list-compress-depth 0
set-max-intset-entries 512
zset-max-ziplist-entries 128
zset-max-ziplist-value 64
hll-sparse-max-bytes 3000
activerehashing yes
client-output-buffer-limit normal 0 0 0
client-output-buffer-limit slave 256mb 64mb 60
client-output-buffer-limit pubsub 32mb 8mb 60
hz 10
aof-rewrite-incremental-fsync yes
啟動Redis
/home/work/lib/redis/bin/redis-server /home/work/lib/redis/conf/6379.conf
2.3 安裝配置Filebeat
在需要收集日志的伺服器上安裝配置Filebeat ,本例在架構圖中ds-beta伺服器上安裝配置Filebeat
# 解壓
[work@ds_beta elk]$ tar xvf filebeat-6.3.1-linux-x86_64.tar.gz

# 編輯配置檔案
[work@ds_beta filebeat]$ grep -Ev "#|^$" filebeat.yml
filebeat.inputs:
- type: log
  enabled: true
  paths:
    - /home/work/*-access.log

filebeat.config.modules:
  path: ${path.config}/modules.d/*.yml
  reload.enabled: true

setup.template.settings:
  index.number_of_shards: 3

setup.kibana:

----------------------------- Redis output -----------------------------
output.redis:
    hosts: ["10.31.152.187"]
    port: 6379
    key: "beta-nginx-access-log"
注意:如果想直接将Filebeat收集到的日志輸出到ElasticSearch中存儲,可以在filebeat.yml中加入這樣的配置:
#-------------------------- Elasticsearch output ---------------------
output.elasticsearch:
  hosts: ["10.31.152.187:9200"]          # es伺服器位址:端口
啟動Filebeat
cd /home/work/lib/filebeat/ && /home/work/lib/filebeat/filebeat run &
注意:
/home/work/lib/filebeat/data/registry
檔案記錄了filebeat收集的日志檔案名、offset(偏移量)、日志檔案的inode号。
2.4 安裝配置Logstash
解壓
tar xvf logstash-6.3.1.tar.gz -C /home/work/lib/elk/logstash
cd /home/work/lib/elk/logstash
mkdir config/conf.d/       # 用于存放解析日志的配置檔案
cd /home/work/lib/elk/logstash/config/conf.d
編輯用于解析Nginx通路日志的配置檔案
[root@monitor conf.d]# cat beta-nginx-access-log.conf
# input {
#   http {
#       port => 7474
#   }
# }

# 從redis中讀取日志資訊
input {
    redis {
        port => "6379"
        host => "127.0.0.1"
        data_type => "list"
        type => "log"
        key => "beta-nginx-access-log"
    }
}

# 對日志進行過濾、解析
filter {
    grok {
        match => {
            "message" => '%{IPORHOST:remote_ip} - %{DATA:user_name} \[%{HTTPDATE:datetime}\] "%{WORD:request_method} %{DATA:uri} HTTP/%{NUMBER:http_version}" %{NUMBER:status_code} %{NUMBER:bytes} "%{DATA:referrer}" "%{DATA:agent}" "(?:%{DATA:http_x_forwarded_for}|-)" "%{DATA:http_cookie}" "%{DATA:query_string}" "%{BASE16FLOAT:request_time}" "%{BASE16FLOAT:response_time}"'
        }
    }

    #mutate {
        #    copy => { "@timestamp" => "@read_timestamp" }
        #}


    date {
        match => [ "datetime", "dd/MMM/YYYY:HH:mm:ss Z" ]
        locale => en
    }

    geoip {
        source => "remote_ip"
        fields => ["country_name", "city_name", "region_name", "location"]
    }

    useragent {
        source => "agent"
        target => "user_agent"
    }

    mutate {
        convert => {
            "bytes" => "integer"
        }
        remove_field => ["headers"]
    }

    mutate {
        add_field => {
            "[@metadata][index]" => "beta-nginx-logs_%{+YYYY.MM}"
        }
    }

    if "_grokparsefailure" in [tags] {
        mutate {
            replace => {
                "[@metadata][index]" => "beta-nginx-logs-failure_%{+YYYY.MM}"
            }
        }
    } else {
        mutate {
            remove_field => ["message"]
        }
    }

}

# 将解析後的日志存儲在elasticsearch中
output {
    elasticsearch {
        hosts => "127.0.0.1:9200"
        index => "%{[@metadata][index]}"
        document_type => "doc"
    }
}

# output {
#   stdout {
#       codec => rubydebug
#   }
# }
以上注釋部分用于調試。
啟動Logstash
cd /home/work/lib/elk/logstash && nohup ./bin/logstash -f config/conf.d/beta-nginx-access-log.conf -r &
這時如果一切正常的話,可以驗證elasticsearch是否有資料:
[root@monitor config]# curl -X GET localhost:9200/_cat/indices
green  open .kibana                         4w1jeWuET_yRWArBXkBtmA 1 0       4   0  37.7kb  37.7kb
yellow open beta-nginx-logs_2018.07         cTykSOQfSp2Z4Tkse0Gftw 5 1    1439   0     2mb     2mb
green  open .monitoring-es-6-2018.08.17     VUfYnzMdTsmP3A-vo-gutw 1 0   14335 392     7mb     7mb
yellow open filebeat-6.3.1-2018.08.17       haqPjrPdRtSEuPJWjzMqiA 3 1 8038175   0   2.3gb   2.3gb
green  open .monitoring-kibana-6-2018.08.17 LF_txPzORUGYDYr-SW-jPw 1 0    1149   0 361.5kb 361.5kb
yellow open beta-nginx-logs_2018.06         xdWR7EdnSCehLH7H2iZYBA 5 1     198   0 583.1kb 583.1kb
yellow open beta-nginx-logs-failure_2018.08 H_1mvh3MQ2GsnVOEGtw9IQ 5 1   29739   0  12.3mb  12.3mb
yellow open beta-nginx-logs_2018.08         jTNfJ44mQr2ofQugG9B3dQ 5 1    1249   0     3mb     3mb
可以看到是我們在logstash的日志解析配置檔案beta-nginx-logs_2018.06\07\08
中定義的索引。這就表明日志經過過濾解析後,已經存儲到ES中了。beta-nginx-access-log.conf
2.5 安裝配置Kibana
Kibana依賴于node,是以先配置node
tar xvf node-v8.11.3-linux-x64.tar.gz
ln -sv node-v8.11.3-linux-x64 node

# 配置環境變量
vim /etc/profile
export NODE_HOME=/home/work/lib/node
export PATH=$PATH:/home/work/lib/node/bin

source /etc/profile
# 解壓
tar xvf kibana-6.3.1-linux-x86_64.tar.gz -C /home/work/lib/elk/kibana

# 編輯配置檔案
[root@monitor kibana]# grep "^[a-z]" config/kibana.yml
server.port: 5701                               # kibana監聽的端口
server.host: "0.0.0.0"
elasticsearch.url: "http://localhost:9200"      # es位址


# 啟動kibana
nohup /home/work/lib/elk/kibana/bin/kibana serve &
通路kibana:
http://IP:5701, 如下圖

點選Management --> Index Patterns 建立索引
配置索引
選擇時間過濾字段名稱
建立完成後,會顯示索引裡每個字段的資料類型
點選Discover
選擇字段檢視結果
至此,完成!
參考部落格: