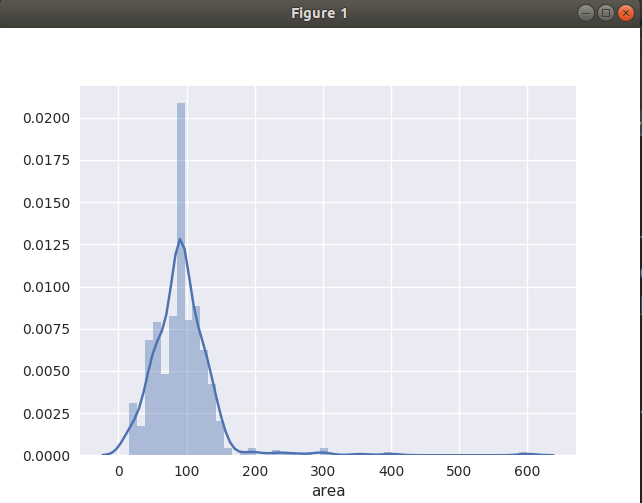
出租房面積(area)

出租房價格(price)
對比資訊
代碼
1 import matplotlib as mpl
 2 import matplotlib.pyplot as plt
 3 import pandas as pad
 4 import seaborn as sns
 5 import numpy as np
 6
 7 sns.set_style('dark')
 8 kf = pad.read_csv('kf.csv')
 9
10 def sinplotone():
11     fig,ax = plt.subplots()
12     ax.violinplot(kf['price'])
13     plt.show()
14
15 def sinplottwo():
16     sns.set_style('whitegrid')
17     sns.boxplot(kf['price'],palette='deep')
18     # sns.despine(left=True)
19     plt.show()
20
21 def sinplotthree():
22     sns.distplot(kf['price'])
23     plt.show()
24
25 def s():
26     df = pad.DataFrame(kf['area'],kf['price'])
27     sns.jointplot(x='x',y='y',data=df)
28     plt.show()
29
30 if __name__ == '__main__':
31     fig,ax = plt.subplots()
32     ax.scatter(kf['area'],kf['price'],12)
33     plt.show()