1. 概述
老話說的好:沉默是金,有時适當的沉默,比滔滔不絕更加有效。
言歸正傳,前面我們聊了有關 Hystrix 降級熔斷的話題,今天我們來聊聊如何使用 turbine 和 hystrix dashboard 總覽項目的熔斷降級情況。
閑話不多說,直接上代碼。
2. 暴露業務服務的 actuator 接口
2.1 主要依賴
<dependency>
            <groupId>org.springframework.boot</groupId>
            <artifactId>spring-boot-starter-actuator</artifactId>
        </dependency>
        <dependency>
            <groupId>org.springframework.cloud</groupId>
            <artifactId>spring-cloud-starter-netflix-hystrix</artifactId>
            <version>2.2.9.RELEASE</version>
        </dependency>
2.2 主要配置
management:
  endpoints:
    web:
      exposure:
        include: '*'
  endpoint:
    health:
      show-details: always
2.3 啟動類中需包含 @EnableHystrix 注解
2.4 啟動服務,檢視接口是否暴露
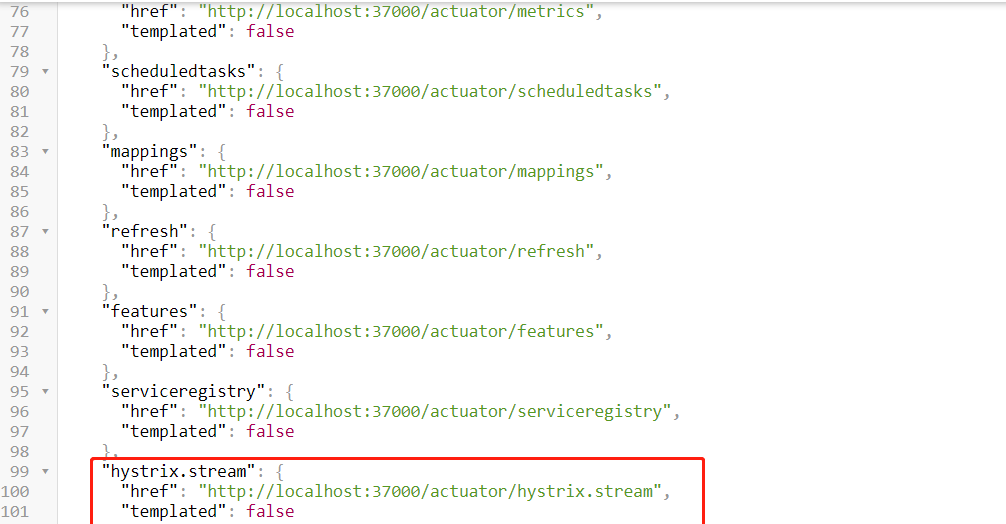
啟動服務後,在浏覽器輸入 http://服務IP:端口/actuator/,檢視是否有 hystrix.stream 接口
3. 建立 turbine 工程
3.1 主要依賴
<dependency>
            <groupId>org.springframework.cloud</groupId>
            <artifactId>spring-cloud-starter-netflix-eureka-client</artifactId>
        </dependency>
        <dependency>
            <groupId>org.springframework.boot</groupId>
            <artifactId>spring-boot-starter-web</artifactId>
        </dependency>
        <!-- 健康檢查 -->
        <dependency>
            <groupId>org.springframework.boot</groupId>
            <artifactId>spring-boot-starter-actuator</artifactId>
        </dependency>
        <dependency>
            <groupId>org.springframework.cloud</groupId>
            <artifactId>spring-cloud-starter-netflix-hystrix</artifactId>
            <version>2.2.9.RELEASE</version>
        </dependency>
        <dependency>
            <groupId>org.springframework.cloud</groupId>
            <artifactId>spring-cloud-starter-netflix-turbine</artifactId>
            <version>2.2.9.RELEASE</version>
        </dependency>
3.2 主要配置
spring:
  application:
    name: my-turbine
  main:
    allow-bean-definition-overriding: true
server:
  port: 38000
management:
  server:
    port: 38001
eureka:
  client:
    service-url:
      defaultZone: http://zhuifengren1:35000/eureka/,http://zhuifengren2:35001/eureka/    # Eureka Server的位址
    healthcheck:
      enabled: true    # 開啟健康檢查, 依賴于 spring-boot-starter-actuator
  instance:
    lease-renewal-interval-in-seconds: 5      # 發出續約指令的間隔,預設30秒
    lease-expiration-duration-in-seconds: 30  # 租期到期時間,預設90秒

turbine:
  app-config: my-feign,my-eureka-client    # 指定需要監控的服務名,監控多個服務逗号分隔
  cluster-name-expression: '"default"'  # 叢集名稱
  combine-host-port: true     # 将端口和hostname作為區分不同服務的條件
  aggregator:
    cluster-config: default
3.3 在啟動類增加注解
@EnableDiscoveryClient
@EnableHystrix
@EnableTurbine
@EnableAutoConfiguration
public class MyTurbineApplication {

    public static void main(String[] args) {
        SpringApplication.run(MyTurbineApplication.class, args);
    }
}
3.4 啟動 turbine 工程,驗證接口
啟動 turbine 工程後,在浏覽器輸入 http://服務IP:端口/turbine.stream,調用降級接口後,會顯示很多過程資料

4. 建立 hystrix dashboard 工程
注意:此工程不需要注冊到 Eureka
4.1 主要依賴
<dependency>
            <groupId>org.springframework.cloud</groupId>
            <artifactId>spring-cloud-starter-netflix-hystrix</artifactId>
            <version>2.2.9.RELEASE</version>
        </dependency>
        <dependency>
            <groupId>org.springframework.cloud</groupId>
            <artifactId>spring-cloud-starter-netflix-hystrix-dashboard</artifactId>
            <version>2.2.9.RELEASE</version>
        </dependency>
        <dependency>
            <groupId>org.springframework.boot</groupId>
            <artifactId>spring-boot-starter-actuator</artifactId>
        </dependency>
4.2 主要配置
spring:
  application:
    name: my-hystrix-dashboard
  main:
    allow-bean-definition-overriding: true
server:
  port: 39000
4.3 在啟動類增加注解
@EnableHystrixDashboard
@SpringCloudApplication
public class MyHystrixDashboardApplication {

    public static void main(String[] args) {
        SpringApplication.run(MyHystrixDashboardApplication.class, args);
    }
}
4.4 啟動 hystrix dashboard 服務
4.4.1 啟動 hystrix dashboard 服務,然後在浏覽器輸入 http://服務IP:端口/hystrix
4.4.2 在 Hystrix Dashboard 頁面輸入 turbine 的位址:http://服務IP:端口/turbine.stream,點選 Monitor Stream 按鈕
4.4.3 Unable to connect to Command Metric Stream. 報錯解決方案
此時,會報 Unable to connect to Command Metric Stream 字樣的錯誤。
這是因為 turbine 位址的域名不在 hystrix dashboard 的允許清單中, 我們在配置檔案中增加 hystrix.dashboard.proxy-stream-allow-list 配置,重新開機服務即可
spring:
  application:
    name: my-hystrix-dashboard
  main:
    allow-bean-definition-overriding: true
server:
  port: 39000


hystrix:
  dashboard:
    proxy-stream-allow-list: "localhost"
4.4.4 重新整理頁面,檢視 dashboard
5. 綜述
今天聊了一下 Hystrix看闆,希望可以對大家的工作有所幫助。
歡迎幫忙點贊、評論、轉發、加關注 :)
關注追風人聊Java,每天更新Java幹貨。
6. 個人公衆号
追風人聊Java,歡迎大家關注