prometheus/grafana 在 k8s 中的部署
上次我們主要分享了 asp.net core 內建 prometheus,以及簡單的 prometheus 使用,在實際在 k8s 中部署的時候就不能在使用前面講的靜态配置的方式來部署了,需要使用 Prometheus 的服務發現。
Prometheus 和 Grafana 的部署放在一個單獨的 namespace —— monitoring 下面,這樣的好處在于可以屏蔽掉一些細節,别的 namespace 無感覺,也不需要知道它們的存在
可以使用 <code>kubectl create namespace monitoring</code> 來建立命名空間或者 <code>kubectl apply</code> 執行下面的 yaml 配置
希望 prometheus 和 grafana 可以公網通路,是以需要配置一下端口号,NodePort 31100~31200 保留為基礎設施使用的端口,31110 保留為 prometheus 需要的端口,31120 保留為 Grafana 端口,端口規劃好後,就可以先配置 nginx 了,增加 nginx 配置如下:
Grafana 比較簡單,部署一個 service,部署一個 deployment 就可以了,Prometheus 要把配置檔案放到 ConfigMap 裡單獨管理,另外 Prometheus 涉及到要使用 k8s 服務發現,需要建立一個 serviceAccount 以有權限來擷取 k8s 中的資源
部署 deployment,deployment yaml 如下,可以根據自己需要進行調整
根據上面的 yaml 定義建立 Grafana 的 deploy,建立之後再建立 service
建立之後就可以在 k8s 叢集外部通路到 Grafana 了,通過前面 nginx 的配置我們就可以直接通過域名通路了
首先我們先建立一個 Service Account,k8s 使用基于角色的 RBAC 授權機制,建立 ServiceAccount 之後還需要建立一個 ClusterRole 和 ClusterRoleBinding,ClusterRole 用于指定權限,ClusteRoleBinding 用來給 serviceAccount 關聯角色,為了友善這幾個都定義在了一個 yaml 檔案中
建立 ServiceAccount 之後,我們建立 Prometheus 的配置檔案,放在 ConfigMap 中挂載在 Prometheus 裡
執行上面的 yaml 配置以部署 prometheus 需要的配置
我們可以利用 prometheus 的 relabel 的機制将一些中繼資料資訊應用的 metrics 資訊上,這樣我們就可以知道這個 metrics 資訊是來自哪一個 namespace 下面哪一個 service 哪一個 Pod 裡,在 Prometheus targets 的界面可以看到所有的 metadata label,或者參考文檔上的介紹 https://prometheus.io/docs/prometheus/latest/configuration/configuration#kubernetes_sd_config
<code>__meta_kubernetes_service_annotation_prometheus_io_should_be_scraped</code> 是我後面加上的,不加這個的話,會嘗試從所有的 k8s 資源中擷取 metrics 資訊,這回導緻很多沒有內建 Prometheus metrics 的資源也會被持續通路,是以增加了這個配置,如果 service 裡的 annotation 裡有 <code>prometheus.io/should_be_scraped</code> 配置的話 Prometheus 才會去拉取 metrics 資訊
需要 Prometheus 抓取 metrics 的 service 配置實力:
如果後面需要配置不同的 metrics_path,也可以使用類似的模式來增加一個 <code>prometheus.io/metrics-path</code> 類似的配置轉換成真正要拉取 metrics 資訊的 path 即可
前面 Prometheus 部署所需要的 serviceAccount 和 config 我們都已經準備好了,執行下面的 yaml 配置就可以部署應用了
deployment 建立之後,隻要根據下面的配置建立 service 就可以通路了
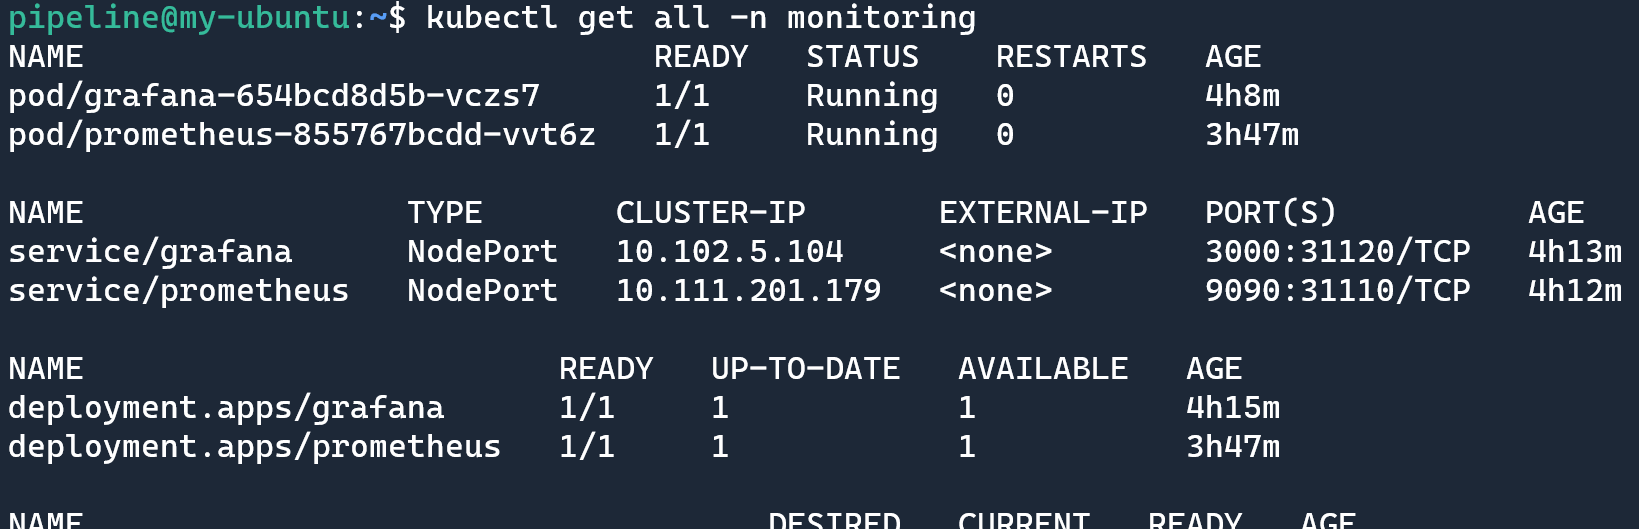
運作 <code>kubectl get all -n monitoring</code> 檢視部署之後的資源情況:
打開 prometheus 可以執行一個簡單的查詢,看一下

在 Grafana 中添加 DataSource,域名使用 service name <code>prometheus</code> 即可,這樣可以通過内網去通路,就不需要繞公網走一圈了
建立一個 Dashboard 把剛才的查詢通過 Grafana 來做一個展示,建立一個 Panel,輸入剛才我們執行的查詢
Legend 中可以使用 lable,使用文法可以用 {{label_name}}
可以在右側友善設定顯示最小值,最大值,平均值,目前值和總計
如果要添加篩選條件如隻看某一個 app 的資料,可以在查詢表達式中添加條件,使用文法 metrics_name{label_name="label_value"}
更多查詢文法可以參考官方文檔的介紹 https://prometheus.io/docs/prometheus/latest/querying/basics/
上面部署的時候沒有做資料的挂載,實際部署的時候需要考慮挂載資料目錄,這樣即使服務重新開機,資料還是在的,如果不關心資料問題的話可以忽略
https://github.com/OpenReservation/ReservationServer/blob/dev/k8s/prometheus/deployment.yaml
https://github.com/OpenReservation/ReservationServer/blob/dev/k8s/prometheus/configMap.yaml
https://github.com/OpenReservation/ReservationServer/blob/dev/k8s/grafana/deployment.yaml
https://github.com/OpenReservation/ReservationServer/blob/dev/k8s/grafana/service.yaml
https://medium.com/kubernetes-tutorials/monitoring-your-kubernetes-deployments-with-prometheus-5665eda54045
https://prometheus.io/docs/prometheus/latest/configuration/configuration
https://prometheus.io/docs/prometheus/latest/querying/basics/
本文版權歸作者和部落格園共有,歡迎轉載,但未經作者同意必須保留此段聲明,且在文章頁面明顯位置給出原文連接配接,否則保留追究法律責任的權利。