漸變色
echarts多個柱子的柱狀圖legend,xaxis,資料之間的關系
關系圖
tooltip換行:簡單的,在formatter中使用
複雜的每行超過幾個字後換行參考
使用原始geo地圖
this.$echarts.registerMap('beijing', beijingMapJson) // 注冊地圖,需引入地圖資料 beijingMapJson
使用bmap作為底圖
public/index.html中引入
vue.config.js中配置
npm安裝echarts
xx.vue中引入
使用
适用于2D圖表中
// 2.0 http://lbsyun.baidu.com/custom/index.htm
mapStyle: {},
// 3.0 http://lbsyun.baidu.com/index.php?title=open/custom
mapStyleV2: {
styleJson: mapStyleJson
},
// See https://lbsyun.baidu.com/cms/jsapi/reference/jsapi_reference.html#a0b1
mapOptions: {},
使用mapbox做底圖
(适合自定義路線,邊界)
工具:http://geojson.io
使用
适用于3D圖表中
// 擷取地圖map對象
const mapboxMap = chart.getModel().getComponent('mapbox3D').getMapbox()
// 設定地圖語言
const lang = localStorage.getItem('I18N_LANG') || 'zh'
mapboxMap.addControl(new MapboxLanguage({
defaultLanguage: lang
}))
// 設定導航工具
mapboxMap.addControl(new mapboxgl.NavigationControl())
環形餅圖使title,subtitle居中,垂直居中修改top的值
折線圖,配置Y軸最小間隔為整數,刻度起始不會強制從0開始
設定Y軸分割線虛線
設定漸變色
(https://gallery.echartsjs.com/editor.html?c=xtnmUAK2r)
symbolSize根據value值設定
擷取數組最大最小值
參考:
https://echarts.apache.org/zh/option.html#yAxis.scale
術語速查手冊
https://echarts.apache.org/zh/cheat-sheet.html
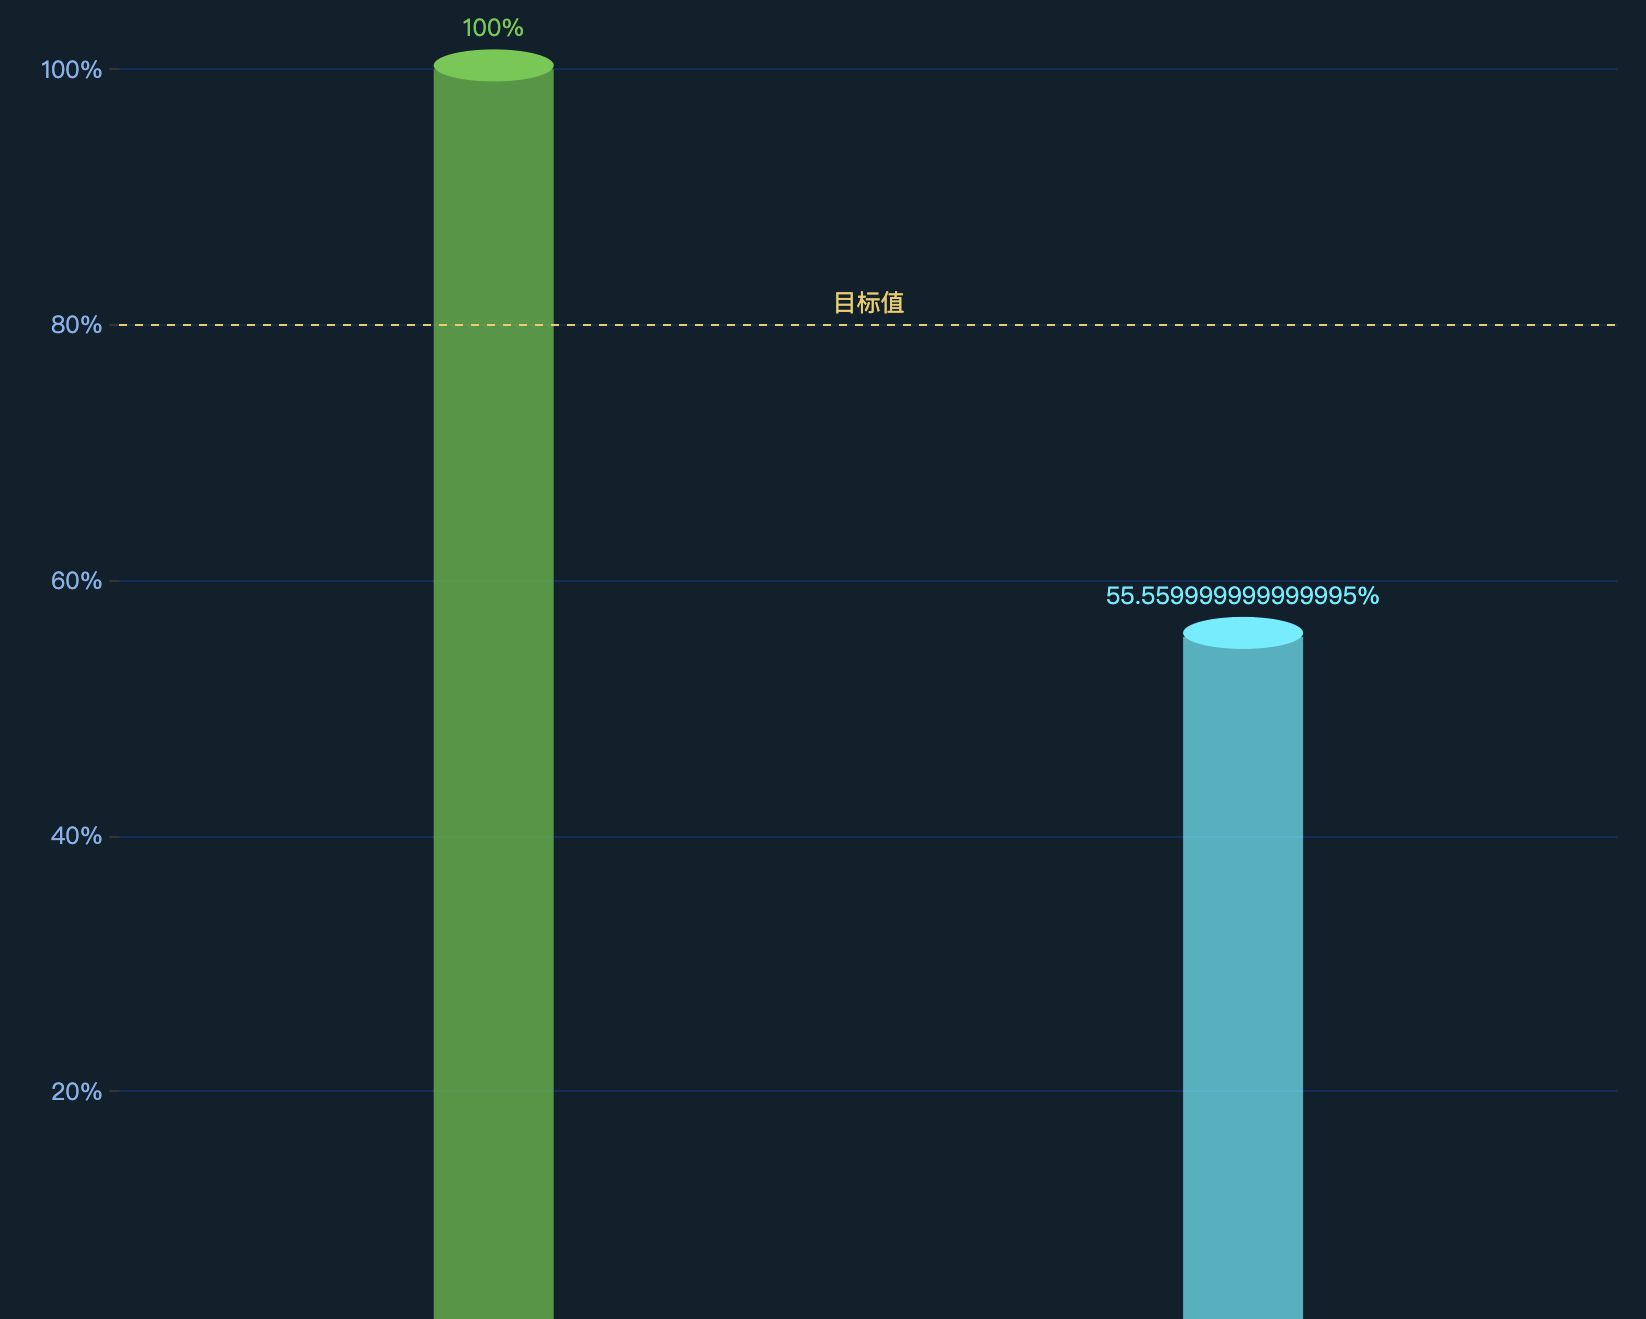
立體柱狀圖:
https://gallery.echartsjs.com/editor.html?c=x0ou4zifid
![Vue使用echarts-wordcloud生成詞雲[圖]](data:image/gif;base64,R0lGODlhAQABAIAAAP///wAAACwAAAAAAQABAAACAkQBADs=)