【問題】
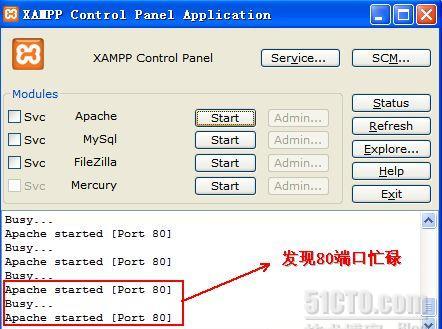
剛剛遇到了一個問題:在安裝了內建環境,XAMPP後,發現我的apahce服務無法啟動。如圖1所示。
【思路】
查找80端口的使用情況。如下圖所示,會發現80端口被程式“Thunder5.exe”(迅雷)占用。

【解決】
關閉迅雷。
【延伸思考】
當我們系統的端口被占用的時候,需要做的和本案例類似,首先查詢占用端口的程式,在上圖中我們可以看到,迅雷的PID,其實除了可以手動關閉對應的程式外,還可以通過殺死對應的程序來實作。
殺死程序:
【延伸閱讀】
xp下還有兩個好東東tasklist和tskill。tasklist能列出所有的程序,和相應的資訊。tskill能清除程序,文法很簡單:tskill 程式名!!
NETSTAT [-a] [-b] [-e] [-n] [-o] [-p proto] [-r] [-s] [-v] [interval]
-a 顯示所有連接配接和監聽端口。
-b 顯示包含于建立每個連接配接或監聽端口的
可執行元件。在某些情況下已知可執行元件
擁有多個獨立元件,并且在這些情況下
包含于建立連接配接或監聽端口的元件序列
被顯示。這種情況下,可執行元件名
在底部的 [] 中,頂部是其調用的元件,
等等,直到 TCP/IP 部分。注意此選項
可能需要很長時間,如果沒有足夠權限
可能失敗。
-e 顯示以太網統計資訊。此選項可以與 -s
選項組合使用。
-n 以數字形式顯示位址和端口号。
-o 顯示與每個連接配接相關的所屬程序 ID。
-p proto 顯示 proto 指定的協定的連接配接;proto 可以是
下列協定之一: TCP、UDP、TCPv6 或 UDPv6。
如果與 -s 選項一起使用以顯示按協定統計資訊,proto 可以是下列協定之一:
IP、IPv6、ICMP、ICMPv6、TCP、TCPv6、UDP 或 UDPv6。
-r 顯示路由表。
-s 顯示按協定統計資訊。預設地,顯示 IP、
IPv6、ICMP、ICMPv6、TCP、TCPv6、UDP 和 UDPv6 的統計資訊;
-p 選項用于指定預設情況的子集。
-v 與 -b 選項一起使用時将顯示包含于
為所有可執行元件建立連接配接或監聽端口的
元件。
interval 重新顯示標明統計資訊,每次顯示之間
暫停時間間隔(以秒計)。按 CTRL+C 停止重新
顯示統計資訊。如果省略,netstat 顯示目前
配置資訊(隻顯示一次)
附:NTSD 中所附的幫助檔案
usage: ntsd [-?] [-2] [-d] [-g] [-G] [-myob] [-lines] [-n] [-o] [-s] [-v] [-w]
[-r BreakErrorLevel] [-t PrintErrorLevel]
[-hd] [-pd] [-pe] [-pt #] [-pv] [-x | -x{e|d|n|i} ]
[-- | -p pid | -pn name | command-line | -z CrashDmpFile]
[-zp CrashPageFile] [-premote transport] [-robp]
[-aDllName] [-c "command"] [-i ImagePath] [-y SymbolsPath]
[-clines #] [-srcpath SourcePath] [-QR machine] [-wake ]
[-remote transport:server=name,portid] [-server transport:portid]
[-ses] [-sfce] [-sicv] [-snul] [-noio] [-failinc] [-noshell]
where: -? displays this help text
command-line is the command to run under the debugger
– is the same as -G -g -o -p -1 -d -pd
-aDllName sets the default extension DLL
-c executes the following debugger command
-clines number of lines of output history retrieved by a remote client
-failinc causes incomplete symbol and module loads to fail
-d sends all debugger output to kernel debugger via DbgPrint
-d cannot be used with debugger remoting
-d can only be used when the kernel debugger is enabled
-g ignores initial breakpoint in debuggee
-G ignores final breakpoint at process termination
-hd specifies that the debug heap should not be used
for created processes. This only works on Windows Whistler.
-o debugs all processes launched by debuggee
-p pid specifies the decimal process Id to attach to
-pd specifies that the debugger should automatically detach
-pe specifies that any attach should be to an existing debug port
-pn name specifies the name of the process to attach to
-pt # specifies the interrupt timeout
-pv specifies that any attach should be noninvasive
-r specifies the (0-3) error level to break on (SeeSetErrorLevel)
-robp allows breakpoints to be set in read-only memory
-t specifies the (0-3) error level to display (SeeSetErrorLevel)
-w specifies to debug 16 bit applications in a separate VDM
-x sets second-chance break on AV exceptions
-x{e|d|n|i} sets the break status for the specified event
-2 creates a separate console window for debuggee
-i ImagePath specifies the location of the executables that generated
the fault (see _NT_EXECUTABLE_IMAGE_PATH)
-lines requests that line number information be used if present
-myob ignores version mismatches in DBGHELP.DLL
-n enables verbose output from symbol handler
-noio disables all I/O for dedicated remoting servers
-noshell disables the .shell (!!) command
-QR queries for remote servers
-s disables lazy symbol loading
-ses enables strict symbol loading
-sfce fails critical errors encountered during file searching
-sicv ignores the CV record when symbol loading
-snul disables automatic symbol loading for unqualified names
-srcpath specifies the source search path
-v enables verbose output from debugger
-wake wakes up a sleeping debugger and exits
-y specifies the symbol search path (see _NT_SYMBOL_PATH)
-z specifies the name of a crash dump file to debug
-zp specifies the name of a page.dmp file
to use with a crash dump
-remote lets you connect to a debugger session started with -server
must be the first argument if present
transport: tcp | npipe | ssl | spipe | 1394 | com
name: machine name on which the debug server was created
portid: id of the port the debugger server was created on
for tcp use: port=
for npipe use: pipe=
for 1394 use: channel=
for com use: port=,baud=,
channel=
for ssl and spipe see the documentation
example: … -remote npipe:server=yourmachine,pipe=foobar
-server creates a debugger session other people can connect to
portid: id of the port remote users can connect to
example: … -server npipe:pipe=foobar
-premote transport specifies the process server to connect to
transport arguments are given as with remoting
Environment Variables:
_NT_SYMBOL_PATH=[Drive:][Path]
Specify symbol p_w_picpath path.
_NT_ALT_SYMBOL_PATH=[Drive:][Path]
Specify an alternate symbol p_w_picpath path.
_NT_DEBUGGER_EXTENSION_PATH=[Drive:][Path]
Specify a path which should be searched first for extensions dlls
_NT_EXECUTABLE_IMAGE_PATH=[Drive:][Path]
Specify executable p_w_picpath path.
_NT_SOURCE_PATH=[Drive:][Path]
Specify source file path.
_NT_DEBUG_LOG_FILE_OPEN=filename
If specified, all output will be written to this file from offset 0.
_NT_DEBUG_LOG_FILE_APPEND=filename
If specified, all output will be APPENDed to this file.
_NT_DEBUG_HISTORY_SIZE=size
Specifies the size of a server’s output history in kilobytes
Control Keys:
Quit debugger
Break into Target
Force a break into debuggee (same as Ctrl-C)
Debug Current debugger
Toggle Verbose mode
Print version information
ntsd: exiting – press enter —