今天看了下微網誌,扔物線分享了個記憶體檢測的工具:
記憶體洩露是 OOM 最常見的原因,但它的偵測需人工排查,往往眼看瞎也未必能找到洩露的記憶體。Square 新庫 LeakCanary 用一種巧妙的思路實作了自動探測記憶體洩露,這已經幫他們減少了94%的 OOM。 在這篇文中,Square 介紹了這個帥氣的庫,也提出了一種新穎的擷取測試裝置的方式:"偷":

是不是這種檢測OOm問題的方式比其MAT來說簡直爽的一逼一逼的。
開源庫位址:https://github.com/square/leakcanary
一下是相關翻譯:
May 08, 2015
這個圖檔的大小是裝置大小,我們在顯示這個圖檔的時候會出現OOM的問題。
We tried a few approaches, none of which solved the issue:
我們嘗試了一些方法,其中沒有解決的問題:
Use <code>Bitmap.Config.ALPHA_8</code> (a signature doesn't need color).
使用bitmap.config.alpha_8
抓住OutOfMemoryError,觸發GC和重試幾次(靈感來自gcutils)。
The bitmap size was not a problem. When the memory is almost full, an OOM can happen anywhere. It tends to happen more often in places where you create big objects, like bitmaps. The OOM is a symptom of a deeper problem: memory leaks.
位圖是沒問題的,如果記憶體滿的話,一個oom會出現在任何地方。當你建立比較大的對象,像bitmap這種東西的地方就會出現這種問題,oom更深層次的問題就是記憶體洩漏的問題。
什麼是記憶體洩漏呢?
Some objects have a limited lifetime. When their job is done, they are expected to be garbage collected. If a chain of references holds an object in memory after the end of its expected lifetime, this creates a memory leak. When these leaks accumulate, the app runs out of memory.
許多對象是有有限制的生命周期的,當他們工作完成後,就會被垃圾回收。當對象的引用在對象的生命周期後還在持有該引用的話,就會出現記憶體洩漏的問題。當引用累計到一定一定時候,就會出現OOM的問題。
For instance, after <code>Activity.onDestroy()</code> is called, the activity, its view hierarchy and their associated bitmaps should all be garbage collectable. If a thread running in the background holds a reference to the activity, then the corresponding memory cannot be reclaimed. This eventually leads to an <code>OutOfMemoryError</code> crash.
例如,在Actiivity ondestroy()後,它的視圖層次結構及其相關的位圖應該都是垃圾收集。如果一個線程在背景運作,持有該activity引用,那麼相應的記憶體不能被回收。這最終導緻OutOfMemoryError錯誤,崩潰。
捕獲OOM的問題是一個手動的過程。
Here are the key steps:
關鍵步驟如下:
Attempt to reproduce the problem. You might need to buy, borrow, or steal the specific device that suffered the crash. (Not all devices will exhibit all leaks!) You also need to figure out what navigation sequence triggers the leak, possibly by brute force.
重制問題,你可能需要購買或者借到一些特殊的裝置來重制crash問題(并不是所有的裝置都會出現這種問題),你需要知道是什麼導緻記憶體洩漏的問題,有可能是蠻力(這句翻譯的有點怪,我擦)。
堆積OOM的問題
Compute the shortest strong reference path from that object to the GC roots.
計算最短路徑的強引用對象的GC根。
Figure out which reference in the path should not exist, and fix the memory leak.
找出那些引用是不應該存在的,并處理記憶體對這些引用。
What if a library could do all this before you even get to an OOM, and let you focus on fixing the memory leak?
如果有一個庫幫助你在oom問題出現之前去檢測OOM的問題,你會去關注如何修複記憶體引用的問題嗎?
Let's look at a cat example:
看下下面的例子:
You create a <code>RefWatcher</code> instance and give it an object to watch:
你創造了一個refwatcher執行個體,給它一個對象去檢測:
When the leak is detected, you automatically get a nice leak trace:
當記憶體檢測的時候,你會檢測到記憶體的記憶體的使用的痕迹。
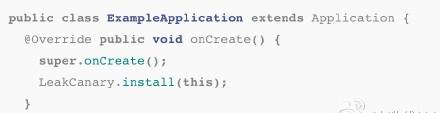
We know you're busy writing features, so we made it very easy to setup. With just one line of code, LeakCanary will automatically detect activity leaks:
You get a notification and a nice display out of the box:
你能得到通知,并且能夠良好的展示在界面上:
The results are amazing. We now have 94% fewer crashes from OOM errors.
結果讓人吃驚,能夠檢測出94%的OOM的問題。
如果你想消除OOM導緻額問題,先學習leakcanary開始
我英語是數學老師教的,如果翻譯的不好,請留言指教下我這個國小生,我一定會改正。