VictoriaMetrics 集成karma
以前有介绍过karma,以下是一个集成,实际上这个肯定是可以跑通的,因为依赖的都是alertmanager这个是都兼容的
环境准备
- docker-compose 文件
version: "3" services: vmstorage: image: victoriametrics/vmstorage ports: - 8482:8482 - 8400:8482 - 8401:8482 volumes: - ./strgdata:/storage command: - '--storageDataPath=/storage' vmagent: image: victoriametrics/vmagent volumes: - ./prometheus.yml:/etc/prometheus/prometheus.yml ports: - 8429:8429 command: - -promscrape.config=/etc/prometheus/prometheus.yml - -remoteWrite.basicAuth.username=dalong-insert-account-1 - -remoteWrite.basicAuth.password=dalong - -remoteWrite.url=http://vmauth:8427 alertmanager: image: prom/alertmanager:latest volumes: - "./alertmanager.yaml:/etc/alertmanager.yaml" command: - --config.file=/etc/alertmanager.yaml - --storage.path=/tmp/alertmanager1 ports: - 9093:9093 vmalert: image: victoriametrics/vmalert volumes: - "./alert.rules:/etc/victoriametrics/alert.rules" ports: - 8880:8880 command: - -rule=/etc/victoriametrics/alert.rules - -datasource.url=http://vmauth:8427 - -datasource.basicAuth.password=dalong - -datasource.basicAuth.username=dalong-select-account-1 - -notifier.url=http://alertmanager:9093 vmauth: image: victoriametrics/vmauth volumes: - "./config.yaml:/etc/victoriametrics/config.yaml" command: - -auth.config=/etc/victoriametrics/config.yaml - -http.disableResponseCompression ports: - 8427:8427 karma: image: lmierzwa/karma:v0.63 volumes: - "./karma.yaml:/etc/karma.yaml" command: --config.file /etc/karma.yaml ports: - 8080:8080 kthxbye: image: lmierzwa/kthxbye:v0.7 command: -alertmanager.uri http://alertmanager:9093 -interval 15s vminsert: image: victoriametrics/vminsert command: - '--storageNode=vmstorage:8400' ports: - 8480:8480 vmselect: image: victoriametrics/vmselect command: - '--storageNode=vmstorage:8401' ports: - 8481:8481 grafana: image: grafana/grafana ports: - 3000:3000 -
配置
主要包含vmagent,vmauth,vmalert.alertmanager,karma
vmagent(就是prometheus 的配置)
global: scrape_interval: 1s evaluation_interval: 1s scrape_configs: - job_name: 'prometheus' static_configs: - targets: ['prometheus:9090'] - job_name: 'vminsert' static_configs: - targets: ['vminsert:8480'] - job_name: 'vmselect' static_configs: - targets: ['vmselect:8481'] - job_name: 'vmstorage' static_configs: - targets: ['vmstorage:8482'] vmauth
users: - username: "dalong-select-account-1" password: "dalong" url_prefix: "http://vmselect:8481/select/1/prometheus" - username: "dalong-insert-account-1" password: "dalong" url_prefix: "http://vminsert:8480/insert/1/prometheus" vmalert 主要是rules
groups: - name: groupGorSingleAlert rules: - alert: VMRows for: 10s expr: vm_rows > 0 labels: label: bar host: "{{ $labels.instance }}" annotations: summary: "{{ $value|humanize }}" description: "{{$labels}}" - name: TestGroup rules: - alert: Conns expr: sum(vm_tcplistener_conns) by(instance) > 1 annotations: summary: "Too high connection number for {{$labels.instance}}" description: "It is {{ $value }} connections for {{$labels.instance}}" - alert: ExampleAlertAlwaysFiring expr: sum by(job) (up == 1) alertmanager
global: resolve_timeout: 30s route: group_by: ["alertname"] group_wait: 5s group_interval: 10s repeat_interval: 999h receiver: "default" routes: - receiver: "default" group_by: [] match_re: alertname: .* continue: true - receiver: "pagination" group_by: ["alertname", "instance"] match_re: alertname: Pagination Test continue: false - receiver: "by-cluster-service" group_by: ["alertname", "cluster", "service"] match_re: alertname: .* continue: true - receiver: "by-name" group_by: [alertname] match_re: alertname: .* continue: true - receiver: "by-cluster" group_by: [cluster] match_re: alertname: .* continue: true inhibit_rules: - source_match: severity: "critical" target_match: severity: "warning" # Apply inhibition if the alertname and cluster is the same in both equal: ["alertname", "cluster"] receivers: - name: "default" - name: "pagination" - name: "by-cluster-service" - name: "by-name" - name: "by-cluster" karma
alertdashboard
- 启动
docker-compose up -d -
一些说明
为了处理slice 报警使用了kthxbye
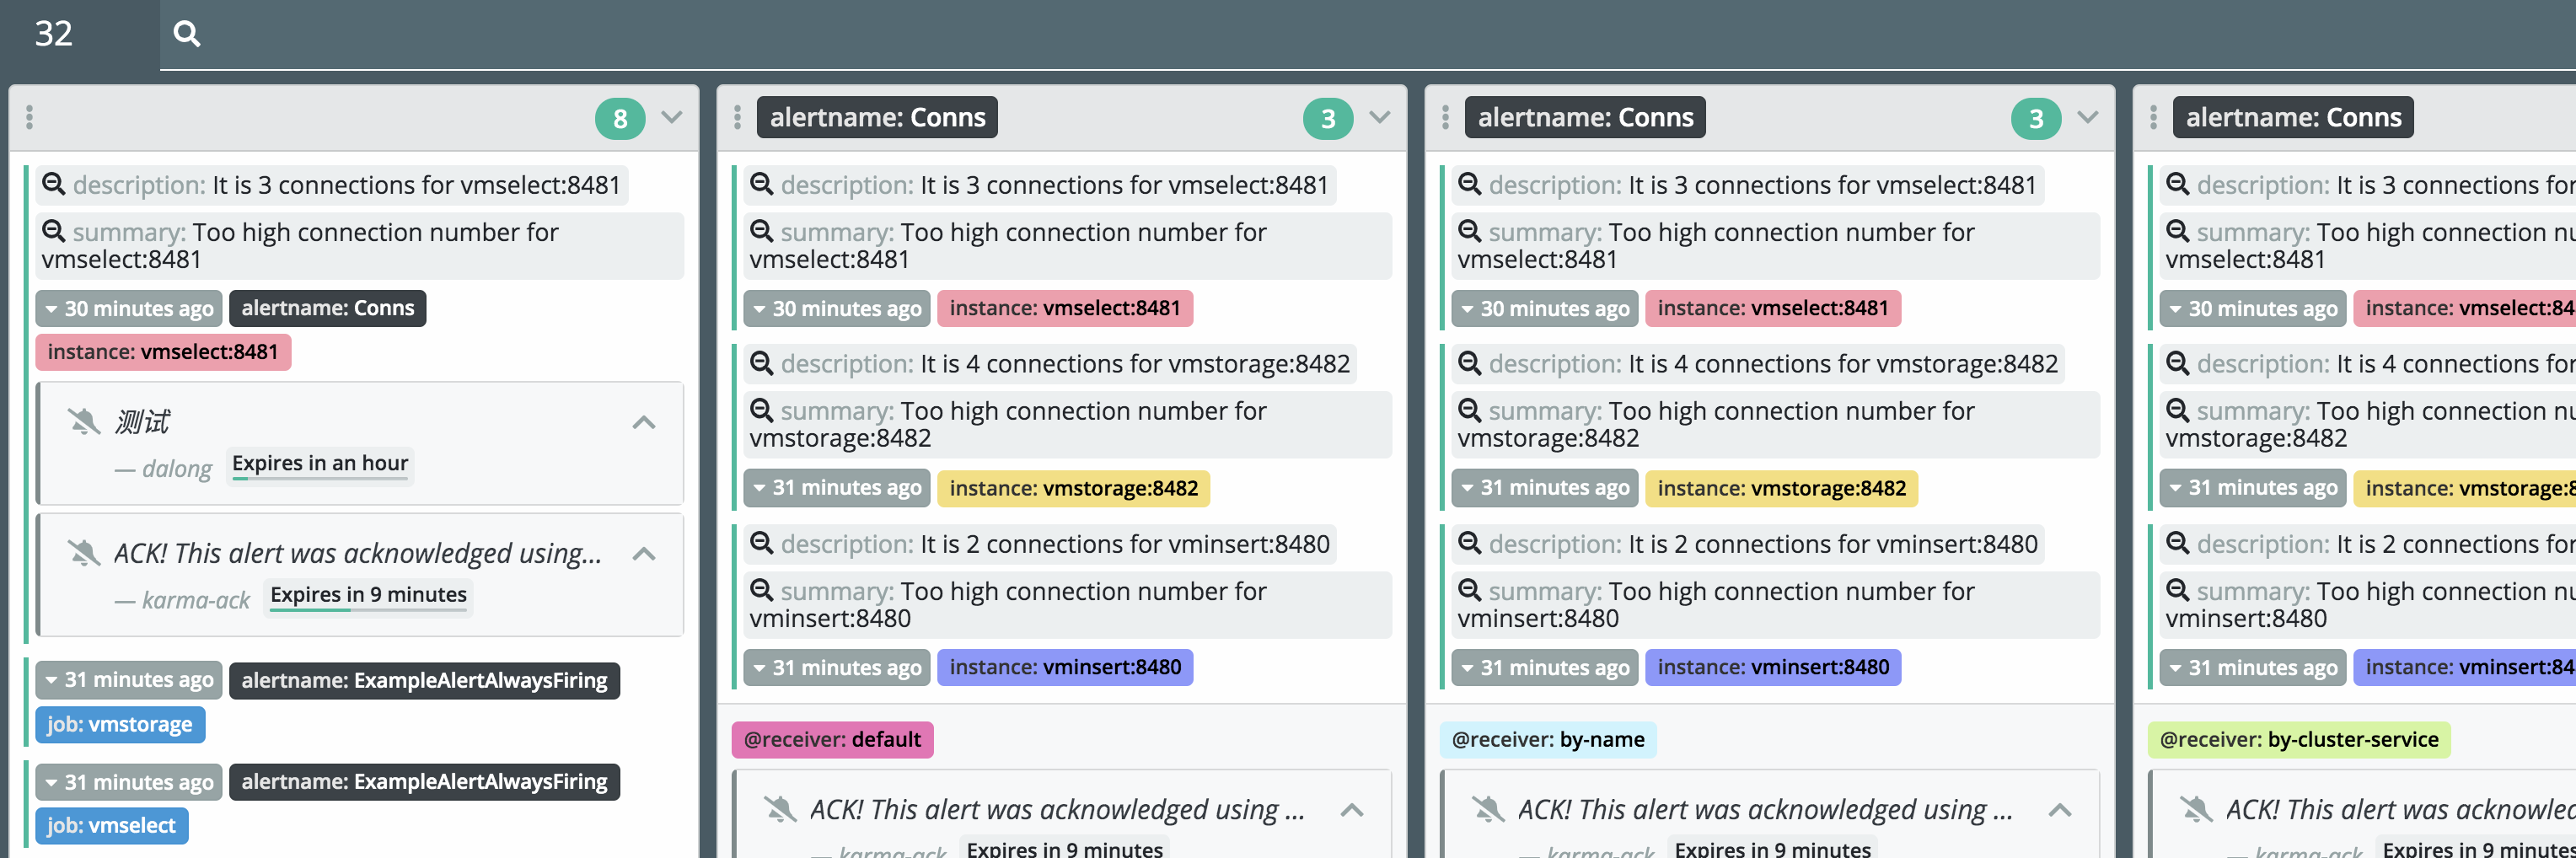
效果
![移动产品设计的八个原则[图]](data:image/gif;base64,R0lGODlhAQABAIAAAP///wAAACwAAAAAAQABAAACAkQBADs=)