二、部分源代码
clear all
clc
close all

SearchAgents_no=30; % Number of search agents

Function_name='F2'; % Name of the test function that can be from F1 to F23 (Table 1,2,3 in the paper)

Max_iteration=500; % Maximum numbef of iterations

% Load details of the selected benchmark function
[lb,ub,dim,fobj]=Get_Functions_details(Function_name);

[Best_score,Best_pos,GWO_cg_curve]=GWO(SearchAgents_no,Max_iteration,lb,ub,dim,fobj);

[Best_score_CS,Best_pos_CS,GWOCS_cg_curve]=GWO_CS(SearchAgents_no,Max_iteration,lb,ub,dim,fobj);


figure('Position',[300 300 660 290])
%Draw search space
subplot(1,2,1);
func_plot(Function_name);
title('Parameter space')
xlabel('x_1');
ylabel('x_2');
zlabel([Function_name,'( x_1 , x_2 )'])

%Draw objective space
subplot(1,2,2);
semilogy(GWO_cg_curve,'Color','r')
hold on
semilogy(GWOCS_cg_curve,'Color','k')
title('Objective space')
xlabel('Iteration');
ylabel('Best score obtained so far');

axis tight
grid on
box on
legend('GWO','GWOCS')

display(['The best solution obtained by GWO is : ', num2str(Best_pos)]);
display(['The best optimal value of the objective funciton found by GWO is : ', num2str(Best_score)]);
display(['The best optimal value of the objective funciton found by GWOCS is : ', num2str(Best_score_CS)]);

% This function draw the benchmark functions

function func_plot(func_name)

[lb,ub,dim,fobj]=Get_Functions_details(func_name);

switch func_name
    case 'F1'
        x=-100:2:100; y=x; %[-100,100]

    case 'F2'
        x=-100:2:100; y=x; %[-10,10]

    case 'F3'
        x=-100:2:100; y=x; %[-100,100]

    case 'F4'
        x=-100:2:100; y=x; %[-100,100]
    case 'F5'
        x=-200:2:200; y=x; %[-5,5]
    case 'F6'
        x=-100:2:100; y=x; %[-100,100]
    case 'F7'
        x=-1:0.03:1;  y=x  %[-1,1]
    case 'F8'
        x=-500:10:500;y=x; %[-500,500]
    case 'F9'
        x=-5:0.1:5;   y=x; %[-5,5]
    case 'F10'
        x=-20:0.5:20; y=x;%[-500,500]
    case 'F11'
        x=-500:10:500; y=x;%[-0.5,0.5]
    case 'F12'
        x=-10:0.1:10; y=x;%[-pi,pi]
    case 'F13'
        x=-5:0.08:5; y=x;%[-3,1]
    case 'F14'
        x=-100:2:100; y=x;%[-100,100]
    case 'F15'
        x=-5:0.1:5; y=x;%[-5,5]
    case 'F16'
        x=-1:0.01:1; y=x;%[-5,5]
    case 'F17'
        x=-5:0.1:5; y=x;%[-5,5]
    case 'F18'
        x=-5:0.06:5; y=x;%[-5,5]
    case 'F19'
        x=-5:0.1:5; y=x;%[-5,5]
    case 'F20'
        x=-5:0.1:5; y=x;%[-5,5]
    case 'F21'
        x=-5:0.1:5; y=x;%[-5,5]
    case 'F22'
        x=-5:0.1:5; y=x;%[-5,5]
    case 'F23'
        x=-5:0.1:5; y=x;%[-5,5]
end


L=length(x);
f=[];

for i=1:L
    for j=1:L
        if strcmp(func_name,'F15')==0 && strcmp(func_name,'F19')==0 && strcmp(func_name,'F20')==0 && strcmp(func_name,'F21')==0 && strcmp(func_name,'F22')==0 && strcmp(func_name,'F23')==0
            f(i,j)=fobj([x(i),y(j)]);
        end
        if strcmp(func_name,'F15')==1
            f(i,j)=fobj([x(i),y(j),0,0]);
        end
        if strcmp(func_name,'F19')==1
            f(i,j)=fobj([x(i),y(j),0]);
        end
        if strcmp(func_name,'F20')==1
            f(i,j)=fobj([x(i),y(j),0,0,0,0]);
        end
        if strcmp(func_name,'F21')==1 || strcmp(func_name,'F22')==1 ||strcmp(func_name,'F23')==1
            f(i,j)=fobj([x(i),y(j),0,0]);
        end
    end
end

surfc(x,y,f,'LineStyle','none');

end
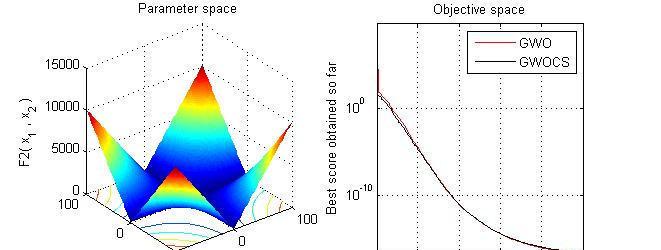
三、运行结果
四、matlab版本及参考文献
1 matlab版本
2014a
2 参考文献
[1] 包子阳,余继周,杨杉.智能优化算法及其MATLAB实例(第2版)[M].电子工业出版社,2016.
![查找算法之二分查找查找算法之二分查找[图]](data:image/gif;base64,R0lGODlhAQABAIAAAP///wAAACwAAAAAAQABAAACAkQBADs=)