经常会看些性能分析的书,但是实际在做优化的时候又无从下手。
因为没有数据,也不能确定实际用户到底在哪一环影响了他们的性能。
写的比较仓促,自己能力也有限,如有问题,欢迎指正。
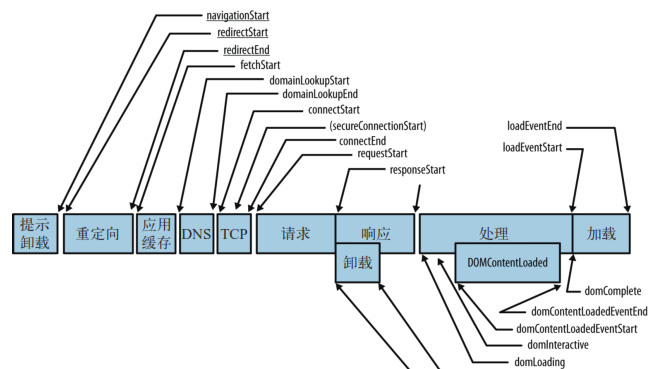
垂直角度的度量顺序图:

1)performance
设置好插件中全局的performance对象,以及方法now,获取当前时间戳。
2)Document.readyState
上图中的“domComplete”、“domInteractive”和“domLoading”,就是Document。readyState的3种状态loading, interactive或complete发生的时间。
3)getTimes()
在这个方法中计算各个参数之间的值。
1. firstPaint:白屏时间,也就是开始解析DOM耗时,用户在没有滚动时候看到的内容渲染完成并且可以交互的时间
2. loadTime:加载总时间,这几乎代表了用户等待页面可用的时间
3. unloadEventTime:Unload事件耗时
4. loadEventTime:执行 onload 回调函数的时间
5. domReadyTime:用户可操作时间
6. firstScreen:首屏时间,用户在没有滚动时候看到的内容渲染完成并且可以交互的时间,记录载入时间最长的图片
7. parseDomTime:解析 DOM 树结构的时间,期间要加载内嵌资源
8. initDomTreeTime:请求完毕至DOM加载耗时
9. readyStart:准备新页面时间耗时
10. redirectTime:重定向的时间
11. appcacheTime:DNS缓存耗时
12. lookupDomainTime:DNS查询耗时
13. connectTime:TCP连接耗时
14. requestTime:内容加载完成的时间
15. requestDocumentTime:请求文档时间,开始请求文档到开始接收文档
16. responseDocumentTime:接收文档时间,开始接收文档到文档接收完成
17. TTFB(Time To First Byte):读取页面第一个字节的时间
performance对象中有个getEntries方法,通过此方法可以将页面中的资源载入情况记录下来。
可以绘制出像下图那样的瀑布图。
然而此方法兼容性非常差,我在红米手机中测试,UC不行,自带的浏览器倒是可以将信息打印出来。
在插件中也稍微封装了一个方法“getEntries”,在兼容的浏览器中可以采集到相关数据。
1. name:资源的完整路径,例如“http://localhost:63342/web/strick/Primus/ajax/data2.json”
2. fileName:文件名。例如“data2.json”
3. duration:资源载入总共消耗的时间
4. requestStartDelay:开始请求延时时间
5. lookupDomainTime:DNS 查询时间
6. connectTime:TCP 建立连接完成握手的时间
7. TTFB:读取资源第一个字节的时间
8. requestTime:内容加载完成的时间
9. requestDuration:请求区间
10. redirectTime:重定向的时间
在一些商业性能采集的应用中,我看到有瀑布图的展示,不知道他们是怎么搞的。
网络状态就是获取当前是“WIFI 2G 3G 4G”等。
如果能获取到这个参数,就能准确知道页面在不同网络状态中展现的情况。
目前只知道这种方法,感觉实用性不是很大。
在index.html中写了个例子,将图片放到某个服务器下面会更准确一些。
现在的页面上面充斥着大量的ajax请求,可以将请求的信息保存起来有助于分析性能。
在项目中使用Zepto库、jQuery等封装好的库,最后还是会调用原生的“XMLHttpRequest”
可以重新一下“XMLHttpRequest”对象,在这个对象的几个步骤中埋入要统计的点。
在open和send中也埋入统计的方法,通过这种方式就能获取到信息了,下图就是统计的信息。
1)UA信息
每个请求头中都会带有“User-Agent”属性,通过这个属性可以分析出OS、Device、Browser、Platform等信息。
我自己没有封装这个头,网上有很多插件可以做分析的工作,不过JS的话有点大。
2)分辨率
这个比较简单就是获取屏幕的物理宽度和高度,一句话就能获取。
异常监控就是监听“window.onerror”事件,在这个事件内能够获取到错误提示信息,行数,列数,错误地址。
1)数据发送
为了更好的跨域,数据发送通过设置Image对象的src来实现。
简单的将各个收集过来的数据作为URL中的参数传过去,代码中可能有BUG。
发送以后就是保存数据了,可以将数据保存在Hadoop中。
2)Primus的引用
由于要计算白屏时间,dom时间等,所以位置不能随便放,得要放在head的最后面。
如果要做点初始化配置也是完全OK的。
源码下载:
<a href="https://github.com/pwstrick/Primus" target="_blank">https://github.com/pwstrick/Primus</a>
参考资料:
<a href="http://githubengineering.com/browser-monitoring-for-github-com/%20" target="_blank">Browser Monitoring for GitHub.com</a>
<a href="http://www.oneapm.com/bi/feature.html%20" target="_blank">Browser Insight</a>
<a href="http://www.alloyteam.com/2014/03/front-end-data-monitoring/" target="_blank">前端相关数据监控</a>
<a href="https://www.zhihu.com/question/37585246" target="_blank">你是如何搭建 Web 前端性能监控系统的?</a>
<a href="http://taobaofed.org/blog/2015/10/28/jstracker-how-to-collect-data/" target="_blank">JSTracker</a>
<a href="http://www.cnblogs.com/ihardcoder/p/5336639.html" target="_blank">从零开始搭建前端数据监控系统(一)-同类产品调研</a>
<a href="http://www.cnblogs.com/chenpingzhao/archive/2015/11/13/4963416.html" target="_blank">使用Javascript监控前端相关数据</a>
<a href="https://varvy.com/performance/document-ready-state.html" target="_blank">Document.readyState</a>
<a href="https://github.com/acelan86/chromeDevTools/wiki/%E8%AF%84%E4%BC%B0%E7%BD%91%E7%BB%9C%E6%80%A7%E8%83%BD%20" target="_blank">评估网络性能</a>
<a href="http://www.cnblogs.com/_franky/archive/2011/11/07/2238980.html" target="_blank">HTML5 performance API 草案.</a>
<a href="http://javascript.ruanyifeng.com/bom/performance.html" target="_blank">Performance API</a>
<a href="http://www.infoq.com/cn/articles/html5-performance-api-monitoring" target="_blank">使用HMTL5 API监控前端性能</a>
<a href="http://www.alloyteam.com/2015/09/explore-performance/" target="_blank">初探 performance – 监控网页与程序性能</a>
<a href="http://www.alloyteam.com/2012/11/performance-api-monitoring-page-performance/" target="_blank">使用performance API 监测页面性能</a>
<a href="http://tech.meituan.com/performance-metric.html" target="_blank">美团性能优化之路——性能指标体系</a>
<a href="http://codingjohnson.com/javascript-precision-timing#.Vz634Pl96Uk" target="_blank">Javascript precision timing</a>
<a href="https://blog.mariusschulz.com/2013/11/22/measuring-execution-times-in-javascript-with-consoletime" target="_blank">Measuring Execution Times</a>
本文转自 咖啡机(K.F.J) 博客园博客,原文链接:http://www.cnblogs.com/strick/p/5750022.html,如需转载请自行联系原作者