The Great Migration of the Chinese Population: A Panorama of 3,000 Counties
Text: Ren Zeping's team
Guide
Population is the foundation of all economic and social activities, and the residential demand brought by population is the foundation of real estate development. We came up with a standard analytical framework that is widely popular in the industry: "real estate looks at population in the long term, land in the medium term, and finance in the short term", and the "Real Estate Cycle" monograph launched in 2017 became a super bestseller. In 2019, we launched "The Great Migration of Chinese: A Panorama of 3,000 Counties", which has attracted wide attention from the market, with more than 100 million views on the entire network.
Based on the county-level population data update of the Seventh Population Census, we present a panoramic view of the population flow trend of nearly 3,000 counties in China on the basis of discussing multidimensional population indicators.
summary
1. Population flow pattern in China's 3,000 counties:
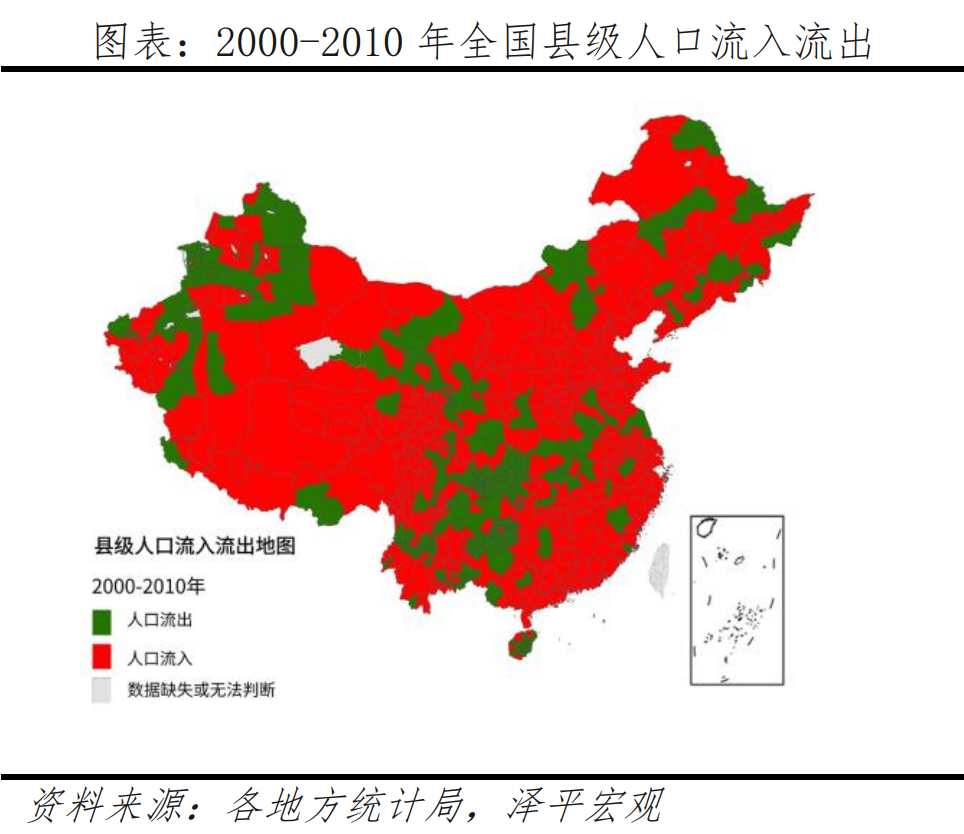
1) At the regional level, from 1978 to 2010, the population who migrated from the central and western regions to the eastern region was dominated by laborers, and the phenomenon of left-behind children in the central and western regions was more obvious. Since 2010, part of the population has returned to the central and western regions, and the eastern region has taken the initiative to promote the localization of foreign populations such as college graduates and skilled talents in the face of employment pressure, and the growth rate of primary school students has accelerated significantly, and the population outflow from the northeast region has accelerated.
2) At the level of tier-1 cities, the permanent population of the first- and second-tier cities continued to flow significantly, the third-tier cities had a slight inflow, the fourth-tier cities were basically balanced, and the fifth- and sixth-tier cities continued to have a net outflow. After 2010, the migrant population in first-, second- and third-tier cities became more and more localized, and the gradient differentiation of the growth rate of primary school students in first-tier cities became more obvious. From 2010 to 2020, under the background of the average annual growth rate of the number of primary school students in the country of 0.7%, the average annual growth rate of the number of primary school students in first-, second- and third-tier cities was 3.8%, 4.7% and 2.4% respectively, while the average annual growth rate of primary school students in fourth, fifth and sixth-tier cities was 1.3%, -0.5% and -1.0% respectively, and the difference between the maximum and minimum growth rates in the first-tier cities widened to 5.7 percentage points.
3) From the perspective of key cities, the permanent population of key cities increased to varying degrees from 2010 to 2020, and the average annual growth rate of permanent population in 37 key cities increased by 0.1 percentage points compared with that from 2000 to 2010.
2. Which areas are inflow and outflow?
1) The flow of Chinese population has moved from four to six to two or eight, indicating that the population flow is becoming more and more concentrated. Excluding the 10 regions that are difficult to identify due to the lack of data, the number of outflow areas showed an upward trend, from 1375 to 1676 in 2000 and 1676 from 2010 to 2020, accounting for 73.9% to 77.9%, and the number of inflow areas decreased from 36.1% to 22.1% in the above two periods, with 776 and 475 respectively.
2) In terms of population outflow areas, the proportion of population outflow areas in Northeast China increased from 66% to 90%, from 58% to 69% in the eastern region, from 67% to 84% in the central region, and from 65% to 77% in the western region. From the perspective of administrative structure, the proportion of population outflow from cities at and above the prefecture level increased from 20% to 30%, county-level cities increased from 63% to 76%, and counties increased from 73% to 88%, with the most significant increase. In terms of sub-lines, there was no outflow of population in first- and second-tier cities, with third-tier cities falling from 18% to 15%, fourth-tier cities increasing from 45% to 57%, fifth-tier cities increasing from 71% to 83%, and sixth-tier cities increasing from 69% to 86%.
3) In terms of population inflow, it is mainly divided into two categories: first, the population flow is more urbanized and urbanized, and the contribution rate of 24 metropolitan areas with more than 10 million people to the national population increase continues to exceed 80%. Second, under the condition that the original industrial advantages are obvious, the eastern coastal areas are still more attractive to labor, and the population inflow of Zhejiang, Fujian, and Jiangsu has increased significantly.
Third, the outlook and enlightenment of Chinese population flow: people go with the industry, people go to high places, and the population will continue to gather in the metropolitan areas of first- and second-tier cities and some regional central cities in the future. The construction of county-level areas adjacent to metropolitan urban agglomerations may be another focus of future development. Therefore, the key to the second housing reform is: urban agglomeration strategy, people-land linkage, financial stability and real estate tax.
Note: Due to the lack of accurate data, Hong Kong, Macao and Taiwan are not included in the analysis of this article.
Risk warning: There are deviations in the official resident population statistics, and there are errors in the identification methods of population movement.
directory
1 The resident population data in the census year, supplemented by the number of primary school students, can effectively determine the trend of population movement
2 Population flow patterns in China's 3,000 counties
2.1 Regional level: the return of labor from the central and western regions, the localization of the migrant population from the east, and the accelerated population flow from the northeast.
2.2 At the level of tier-1 cities: the first- and second-tier population has flowed into the fifth and sixth-tier cities significantly, and the children of the labor force have gradually moved with them
2.3 Key cities: The population of core cities in the central and western regions maintained rapid growth, while the population growth of some core cities in the east slowed down
3 Which areas are incoming and outflowing?
3.1 Criteria for judging the number of permanent residents and primary school students
3.2 Panorama of population flow in 3,000 counties: Population movement has accelerated, and the number of areas of population outflow has increased significantly
3.3 Prospects and enlightenment of Chinese population mobility: people go with industry, and people go to higher places
body
1 The resident population data in the census year, supplemented by the number of primary school students, can effectively determine the trend of population movement
The analysis of demographic data requires an understanding of demographic regulations, and many fallacies arise due to a lack of understanding of statistical regulations. There are three main ways to conduct statistical surveys of Chinese population data: first, the population census, which has been conducted since 1990 in the "0" year of the tail number, and the data is relatively accurate, but there are still omissions, and a total of 7 times have been carried out since 1949; the second is the 1% population sample survey (commonly known as the "mini census"), which is conducted in the "5" year of the tail number, and the data is relatively accurate; the third is the sample survey of 1‰ population changes in other years, and the data deviation is relatively large. The 10-year census is the most accurate population information, so we analyze the data at intervals of 10 years, i.e. 2000-2010 and 2010-2020.
The data on primary school students come from the education department, which is highly accurate and represents the potential of the young population, which can be compared with the national level and the differences in school enrollment policies, so as to compare and analyze population mobility. The number of primary school students is the number of registered students in educational institutions, which is generally more accurate. In 1987 and 1994, more than 97% and 98% of school-age children in China were enrolled in school, and after 1999, they were basically above 99%, and in 2018, they reached 100%. Although there may be a motive for false registration in some regions to obtain compulsory education subsidies, the proportion is small. In 2016, the number of students enrolled in ordinary primary schools in mainland China was 17.525 million, which was 1.645 million more than the number of births in the 2010 census six years ago, which means that the omission rate of the 0-year-old population at that time was not less than 9.4%. In 2020, only 18 prefecture-level administrative units in the country lacked data on primary school students, accounting for 0.8%.
In addition to population mobility, changes in the number of primary school students are also affected by demographic changes, regional enrollment policies, and the supply of educational resources. From the perspective of population structure, corresponding to the three waves of baby booms after the founding of the People's Republic of China in 1949, the number of primary school students in China experienced three peaks in 1960, 1975 and 1997, and then decreased from 139.95 million in 1997 to 93.61 million in 2013, and then bottomed out to 107.25 million in 2020. During this period, the number of primary school students continued to decline in most cities across the country, such as Beijing from 1994 to 2006 and Shanghai from 1993 to 2007. From the perspective of regional enrollment policies and the supply of educational resources, except for a few large cities, most areas do not strictly restrict the enrollment of children of immigrants. Since 2013, Beijing, Shanghai and other megacities have strictly tightened the school enrollment policy for children of migrants due to the need for population control. The number of students enrolled in ordinary primary schools in Beijing fell from 166,000 to 145,000 in 2013-2016 and rebounded to 186,000 in 2021, of which the proportion of non-Beijing students dropped from 45.2% to 31.7% in 2013-2015. In addition, the average annual growth rate of primary school students in Beijing and Dongguan, Guangdong Province, from 2010 to 2020, was 4.3%, but this does not mean that the population flow trend of the two cities is similar. Beijing has tightened its policy on the enrollment of children of immigrants to strictly control the population, while Dongguan has met the needs of a large number of children of immigrants in order to develop the manufacturing industry. Therefore, the indicative significance of the number of primary school students on population mobility cannot be obtained through longitudinal comparison of individual cities, or horizontal comparison between two cities, but can be roughly controlled for relevant differences through regional and national comparisons, and urban or regional groupings to study population trends.

2 Population flow patterns in China's 3,000 counties
2.1 At the regional level: the return of labor from the central and western regions, the localization of the migrant population from the east, and the accelerated outflow of the population from the northeast
After the reform and opening up, China's inter-provincial migration experienced a transition from the southeast of the peacock to the return of the central and western regions around 2010, and the inter-provincial migration slowed down significantly due to the industrial transfer of the central and western regions to the eastern region and the aging population. With the addition of primary school student data, we will see a clearer and more detailed picture of population movements.
From 1978 to 2010, the population who migrated from the central and western regions to the eastern region was mainly laborers and did not have children, and the phenomenon of left-behind children in the central and western regions was more obvious. From 1978 to 2010, the average annual growth rate of permanent population in the eastern, central, western and northeastern regions was 1.39%, 0.86%, 0.85% and 0.73% respectively, and the proportion of permanent population changed by 4, -1.6, -1.7 and -0.8 percentage points respectively. However, the average annual growth rate of primary school students in the eastern, central, western and northeastern regions was -1.12%, -1.11%, -1.03% and -2.60% respectively, and the proportion of primary school students changed by 0.8, 0.8, 1.6 and -3.2 percentage points respectively.
Since around 2010, part of the population has returned to the central and western regions, and the eastern region has taken the initiative to promote the localization of foreign populations such as college graduates and skilled talents in the face of employment pressure, and the growth rate of primary school students has accelerated significantly, and the population outflow from the northeast region has accelerated. In 2009, the proportion of migrant workers working in the Yangtze River Delta and Pearl River Delta regions decreased by 2.4% and 7.6% respectively compared with the previous year, and in the second half of 2009, there was an obvious "labor shortage" in the eastern coastal areas. In the face of employment pressure, the eastern region has taken the initiative to deepen the reform of the household registration system and attract migrants to live and work in peace and contentment. For example, since 2011, Jinjiang, which is famous for its footwear and apparel industry, took the lead in implementing the zero-threshold "residence permit" system in Fujian, and in 2013, it took the lead in implementing the policy of "settling down without housing". In 2014, after the State Council called for further reform of the household registration system, in 2015 Fujian announced that it would fully relax the restrictions on settlement in areas other than Fuzhou, Pingtan and Xiamen, and Guangdong announced that it would allow immediate family members to take refuge in Guangzhou, and relax the household entry requirements for graduates with college degree or above (including junior college), skilled personnel and special professionals. From 2010 to 2020, the average annual growth rate of permanent population in the eastern, central, western and northeastern regions was 1.08%, 0.22%, 0.61% and -1.05%, respectively, and the proportion of permanent population changed by 2.2, -0.8, 0.2 and -1.2 percentage points, respectively. Although the growth rate of permanent population in the eastern region has decreased significantly, the growth rate of primary school students has increased instead of falling. The average annual growth rate of primary school students in the eastern, central, western and northeastern regions was 2.53%, -0.15%, 0.09% and -2.22%, respectively, and the proportion of primary school students changed by 6.1, -2.7, -2.0 and -1.4 percentage points respectively.
In terms of provinces, after 2010, the population of Guangdong and Zhejiang coexisted with the re-agglomeration and return of Guizhou, Sichuan, Chongqing and Hubei, and the population loss of Heilongjiang was relatively large among the three northeastern provinces. From 2010 to 2020, the top five provinces with the average annual permanent population increase were Guangdong, Zhejiang, Jiangsu, Shandong, and Henan, and during this period, the population of six provinces, including Gansu, Inner Mongolia, Shanxi, Liaoning, Jilin, and Heilongjiang, shrank, all of which were located in the north. Specifically, from 2010 to 2020, the average annual permanent population growth rate of Guangdong and Zhejiang was 2.169 million and 1.014 million respectively, and the average annual population growth rate of central and western provinces such as Guizhou, Sichuan and Hubei changed from negative growth to positive growth after 2010 from 2000 to 2010, and the average annual population growth rate of the three northeastern provinces changed from positive growth from 2000 to 2010 to negative growth from 2010 to 2020, and the decline has expanded in recent years. In 2020, Guangdong had a permanent population of 130 million, ranking first in the country for 14 consecutive years. This is because Guangdong has a developed economy, with the largest GDP in the country for 28 consecutive years, and the relatively loose settlement policy, which has attracted a large number of foreign population, especially young and middle-aged people. From 2010 to 2020, the proportion of the inflow population from other provinces to the permanent population increased from 20.61% to 23.51%. However, Heilongjiang's permanent population is only 31.85 million, and the total population has fallen for seven consecutive years. In 2020, the GDP ranked 27th in the country, with a per capita GDP of 36,500 yuan, which is half of the national per capita GDP and ranked last in the country. Second, the industrial structure is dominated by agriculture and industry, of which industry is dominated by heavy industry, which is characterized by the need for a large amount of investment, but the number of jobs provided is limited, resulting in the loss of labor. Third, Heilongjiang's birth rate is low, only 3.74 per thousand in 2020, less than half of the national birth rate (8.52 per thousand) in the same period.
2.2 At the level of tier-1 cities: the first- and second-tier population has flowed into the fifth and sixth-tier cities significantly, and the children of the labor force have gradually moved with them
In the Great Migration of the Chinese Population, we divide the current 336 administrative units at and above the prefecture level into first, second, third and fourth tier cities. In order to more accurately grasp population flow, this paper takes the municipal districts, counties and county-level cities of cities above the prefecture level as the basic units, and further subdivides the 2850 county-level administrative units in Chinese mainland (excluding Kinmen County in Fujian Province) into 2177 regions, and divides them into first-, 234-55 and sixth-tier cities according to factors such as GDP, political status and permanent population. Due to the large scope of Chongqing's jurisdiction, we have treated it as two parts: the nine districts of the main city and the municipal districts of the nine districts of the non-main city, which increases the number of municipal districts of cities at and above the prefecture level by one to 298.
Among them, there are 4 first-tier cities in Beijing, Shanghai, Guangzhou and Shenzhen, and the GDP of first-tier cities in 2020 will be more than 2 trillion yuan, of which Beijing and Shanghai will exceed 3 trillion yuan. There are 33 second-tier cities in total, with the exception of some provincial capitals that are weaker but have a prominent regional center status, and the GDP of second-tier cities is more than 500 billion yuan. There are 73 third-tier cities, including weak provincial capitals with a GDP of more than 100 billion yuan, some strong prefecture-level municipal districts, and a few county-level cities with outstanding strength. Most of the fourth-, fifth- and sixth-tier cities are other cities with GDP of more than 42 billion yuan, more than 16 billion yuan and less than 16 billion yuan respectively, mainly weak prefecture-level city districts, county-level cities and counties, with 257, 607 and 1,203 respectively. Among the 2,177 regions, according to the 2020 census data, the population data of Xinjiang cities and sub-prefecture administrative levels are missing, but they have little impact on the analysis of the overall population trend of sub-tier cities.
The permanent population of first- and second-tier cities continued to flow in but the growth rate slowed down, the third-tier cities saw a slight inflow, the fourth-tier cities basically maintained a balanced state, and the fifth- and sixth-tier cities continued to outflow. From the perspective of population growth, the average annual growth rate of permanent population in first- and second-tier cities was 3.4% and 2.7% respectively from 2000 to 2010, and slowed down to 2.4% and 2.7% respectively from 2010 to 2020. The average annual growth rate of the resident population in third-tier cities increased slightly to 1.5% from 1.3% in 2000-2010. Fourth-tier cities grew from 0.6% from 2000 to 2010 to 0.7% from 2010 to 2020 in a state of basic equilibrium. From 2010 to 2020, the average annual population growth rate of fifth- and sixth-tier cities was -0.4% and -0.8%, and from 2000 to 2010, there was a basic equilibrium, and the outflow of population expanded. From 2010 to 2020, the proportion of permanent residents in first-, second-, third- and fourth-tier cities increased by 1.0, 3.2, 1.1 and 0.3 percentage points, respectively, while those in fifth- and sixth-tier cities decreased by 2.5 and 2.9 percentage points respectively (because the total population data of each region is not equal to the whole country, the total proportion of increase and decline is not exactly equal). Comparing the 2000-2010 and 2010-2020 census data, we find that the trend of continuous population flow to the first and second tiers has not changed, the population concentration continues to increase, and the opportunities brought by industry still have a greater drive for population movement, but the overall growth rate has slowed down, while the population of the fifth and sixth tier cities has maintained an outflow trend.
In the context of the localization of foreign population to first-, second- and third-tier cities, the urban differentiation of primary school student growth rate is more obvious. From 2000 to 2010, under the background of the average annual growth rate of the number of primary school students in the country of -2.7%, the average annual growth rate of the number of primary school students in the first-, second- and third-tier cities was 0.7%, -0.9% and -2.5% respectively, and the average annual growth rate of primary school students in the fourth, fifth and sixth tier cities was -3.1%, -2.8% and -3.1% respectively, and the difference between the maximum and minimum values of the sub-tier cities was 3.8 percentage points. From 2010 to 2020, under the background of the average annual growth rate of the number of primary school students in the country of 0.7%, the average annual growth rate of primary school students in first-, second- and third-tier cities was 3.8%, 4.7% and 2.4% respectively, while the average annual growth rate of primary school students in fourth, fifth and sixth-tier cities was 1.3%, -0.5% and -1.0% respectively, and the difference between the maximum and minimum growth rates of first-tier cities widened to 5.7 percentage points. Due to factors such as high housing prices and tight supply and demand of academic degrees, the growth rate of first-tier cities is lower than that of second-tier cities, and faster than that of other tier-1 cities, and overall they are still relatively attractive.
2.3 Key cities: The population of core cities in the central and western regions maintained rapid growth, while the population growth of some core cities in the east slowed down
From 2010 to 2020, the permanent population of key cities increased to varying degrees, and the average annual growth rate of permanent population in 37 key cities increased by 0.1 percentage points compared with that from 2000 to 2010. Affected by the return of labor, the growth rate of permanent population in key cities in the eastern region is generally lower than that in the central and western regions, and the average annual growth rate of permanent population from 2010 to 2020 is 0.5 percentage points lower than that in the central and western regions. In addition, the growth rate of primary school students in the central and western regions was 2.8 percentage points higher than that in the eastern region. From the perspective of permanent resident population, the average annual growth rate of permanent resident population in key cities in central and western China from 2010 to 2020 increased by 1.3 percentage points compared with that from 2000 to 2010. The average annual growth rate of permanent population in key cities in the central and western regions such as Changsha, Xi'an, Zhengzhou, Chengdu and other municipal districts is more than 3%, but the population growth rate of Urumqi, the first echelon city of population growth from 2000 to 2010, has plummeted, while the average annual growth rate of permanent population in key cities in the eastern region from 2010 to 2020 has decreased by 0.7 percentage points compared with 2000-2010, which is generally lower than that of key cities in the central and western regions in the same period. Tianjin, Nanjing and other municipal districts are even lower than the national average, but at the same time, the population growth rate of Guangzhou and Shenzhen is still leading the country. For example, Suzhou, Hefei, Wuxi, and Nanjing had an average annual growth rate of 9.3%, 7.5%, 5.5%, and 5% respectively from 2010 to 2020. In addition, the average annual growth rate of primary and secondary school students in key cities is higher than 4%, including Beijing, Shijiazhuang, Taiyuan, Dalian, Hangzhou, Xiamen, Dongguan, Wuhan, Changsha, Zhengzhou, Shenzhen, Xi'an, Chongqing, Chengdu, etc.
The fastest growing population in the central and western regions is Zhengzhou, which has relied on the hub advantages of the Central Plains region and the status of the capital of Henan Province to siphon Henan's population and vigorously develop the economy since 2008. From 2010 to 2020, Zhengzhou's permanent population increased by nearly 4 million, making it the third most populous city in Henan to the first in Henan. From 2010 to 2020, the average annual growth rate of the permanent population was 3.9%, an increase of 1.2 percentage points from 2000 to 2010. The development and construction of Zhengzhou Airport and Zhengzhou's original status as a railway hub have created convenient transportation in Zhengzhou, attracting many enterprises such as Foxconn and BYD to settle down, forming a relatively complete industrial chain. According to customs data, in 2020, Zhengzhou accounted for 74.3% of Henan's provincial trade in goods, and Henan's trade in goods exceeded 650 billion yuan, reaching 665.48 billion yuan, an increase of 16.4%, ranking 10th and 3rd in the country respectively, with an increase of 14.5% higher than the national rate. At the same time, Henan Province is the largest province in China with a registered population of more than 100 million, providing a broad soil for Zhengzhou's urban expansion. This compares to Hubei Province's population of 57.75 million, while the provincial capital Wuhan has a population of 12.45 million. Zhengzhou has a population of 12.6 million in 2020, and there is still a lot of room for growth in Henan.
Urumqi and Chongqing have seen slower population growth in the western region, with average annual growth rates of 1.5% and 1.1% respectively from 2010 to 2020. Compared with the average annual growth rate of permanent population in Urumqi from 2000 to 2010, it decreased by 1.8 percentage points, while Chongqing successfully reversed the downward trend and turned positive. The reason is that although the level of urbanization in the central and western regions is still low, Urumqi's economic construction and industrial development are relatively weak, and compared with other cities in the central and western regions such as Chengdu and Chongqing, urban construction lacks talent competitiveness, and it is difficult to attract more people in the process of urbanization. Chongqing is still a city with a net outflow of population, but the outflow curve continues to improve, and the return of labor is an important factor. According to the Chongqing Statistical Bulletin, there were 5.226 million migrant workers in 2019, a decrease of 3.6% over the previous year, and the number of migrant workers in Chongqing fell for three consecutive years. Behind the return of labor is the contrast of economic growth. From 2000 to 2010, the economic growth in the eastern region was faster, and Chongqing's economy was only the national average. From 2010 to 2020, Chongqing's GDP grew by 210%, much higher than the national 146%, and the proportion of GDP in the national total in 2020 has reached 2.46%, higher than 1.82% and 1.95% in 2000 and 2010.
3 Which areas are incoming and outflowing?
3.1 Criteria for judging the number of permanent residents and primary school students
In general, we use whether the growth rate of permanent population is higher than the natural growth rate of the population of the province or local city, and whether the growth rate of primary school students is higher than the national average as the identification criteria for judging the inflow and outflow of population in the municipal districts, county-level cities and counties of 2,177 cities at and above the prefecture level in China. Due to the lack of data in 2020, the average of the natural growth rate of permanent population in 2010, 2015 and 2019 was taken as the natural growth rate of permanent population from 2010 to 2020. Considering that there are still differences in the natural population growth rate of each region within each province and each administrative unit at the local level, there is inevitably a certain error in the identification of this paper.
Based on the two indicators of permanent resident population and primary school students, the specific identification criteria for population inflow and outflow are as follows: 1) If the data of permanent resident population are available, the permanent resident population is used as the standard to identify population inflow and outflow. 2) If there is a shortage of permanent residents and an influx of primary school students, it is difficult to judge whether the permanent population has inflowed from historical experience, so this type of area is listed as pending. For example, in some areas in the eastern part of the country, there are two phenomena of both the return of the migrant population and the influx of primary school students, that is, the outflow of permanent residents and the inflow of primary school students; on the contrary, in some traditional labor-exporting areas, some labor force returns, but at the same time, some of the migrant labor force moves out of their household registration to settle down in their places of employment, that is, the inflow of permanent residents and the outflow of primary school students.
Overall, the number of regions that could not be identified due to missing data dropped from 68 to 10, and the proportion dropped from 3.1% to 0.5%. Among them, 14 regions lacked data on permanent population and primary school students from 2000 to 2010, and 11 regions lacked permanent population data from 2010 to 2020. A total of 15 of the above-mentioned areas were excluded, mainly distributed in Xinjiang, Tibet, Hainan and other provinces.
3.2 Panorama of population flow in 3,000 counties: Population movement has accelerated, and the number of areas of population outflow has increased significantly
Excluding the 10 regions that are difficult to identify due to the lack of data, the number of outflow areas showed an upward trend, from 1375 to 1676 in 2000 and 1676 from 2010 to 2020, accounting for 73.9% to 77.9%, and the number of inflow areas decreased from 36.1% to 22.1% in the above two periods, with 776 and 475 respectively.
By region, the proportion of population outflow increased from 66% to 90% in Northeast China, from 58% to 69% in the eastern region, from 67% to 84% in the central region, and from 65% to 77% in the western region. From 2000 to 2010 and 2010 to 2020, the number of outflow areas increased from 57.5% to 69.4%, while the number of outflow areas in the central region increased significantly, with 376 and 466 areas, respectively, accounting for 67.4% to 83.5%, and the number of outflow areas in the western region increased from 592 and 701, respectively, accounting for 64.8% to 76.8%. The number of outflow areas in Northeast China increased slightly, from 117 to 159 in the two periods, accounting for 89.8% of the total, up from 66.1%. In terms of provinces, excluding Beijing, Tianjin, Shanghai and Xinjiang, Tibet and other regions with more missing data, Heilongjiang has a large number of outflow areas, accounting for 94.7% of the outflow areas from 2010 to 2020, followed by Shaanxi 93.1%, Jilin 91.5%, and Shanxi 89.2%. In the past 10 years, the population loss in Northeast China has been serious, and the prosperity and development of developed regions such as the Yangtze River Delta and the Pearl River Delta region have a strong attraction to the population of Northeast China.
From the perspective of administrative structure, the proportion of population outflow from cities at and above the prefecture level increased from 20% to 30%, county-level cities increased from 63% to 76%, and counties increased from 73% to 88%, with the most significant increase. In 2000-2010 and 2011-2020, the number of outflow areas from prefecture-level cities increased from 59 to 90, accounting for 30.3% from 19.9 percent, to 236 and 286 in the two periods, from 62.8 percent to 76.1 percent, and from 73 percent to 87.9 percent. The proportion of population outflow in cities at and above the prefecture level and municipal districts increased most significantly.
In terms of sub-lines, there was no outflow of population in first- and second-tier cities, with third-tier cities falling from 18% to 15%, fourth-tier cities increasing from 45% to 57%, fifth-tier cities increasing from 71% to 83%, and sixth-tier cities increasing from 69% to 86%. The first- and second-tier cities have maintained a strong population inflow trend, with the number of population outflow areas from 2000 to 2010 and 2010-2020 both zero, while the proportion of population outflow areas in third-tier cities increased slightly, from 17.6% to 14.9%, and the number of population outflow areas in fourth-tier cities increased from 45.2% to 56.7% in the two periods, respectively. The proportion of population outflow in fifth- and sixth-tier cities increased from 71.1% to 82.9%, and sixth-tier cities increased from 69.3% to 86.4%. It can be seen that the proportion of population outflow areas in the sixth-tier cities increased most significantly, reaching 17.1 percentage points, which was higher than that of the third-, fourth-, and fifth-tier cities by -2.7, 11.4, and 11.8 percentage points.
From the perspective of population inflow areas, there are two main characteristics of population flow in recent years:
First, the population flow has become more urbanized and urbanized, and the contribution rate of 24 metropolitan areas with more than 10 million people to the national population growth has continued to exceed 80%. After 2015, the settlement in large cities was greatly relaxed, and then a fierce "grab" war was triggered across the country, and the population flowed into first- and second-tier cities. For example, the permanent population of Guangdong Province increased by 20.96 million from 2010 to 2020, and the total growth of Guangzhou and Shenzhen alone was as high as 13.18 million, contributing 62.9% to the province's population growth. Guangzhou's relatively relaxed settlement policy and strong population attraction are important reasons why Guangdong Province has accounted for as much as 80% of the population outflow in recent years, and most areas in the Pearl River Delta region except Guangzhou, Shenzhen, Foshan and Zhuhai are also in a state of population outflow. In addition to urbanization, the characteristics of metropolitan agglomeration of population flow are also becoming more and more obvious. In terms of the contribution of population increment, the contribution rate of population increase in 24 metropolitan areas with more than 10 million people has gradually increased, from 80.2% in 2000-2010 to 94.9% in 2010-2020 (excluding areas with missing data). In terms of the proportion of population inflow areas, the proportion of areas located in metropolitan areas increased by excluding areas with missing data, which were 17.2% and 28.2% from 2000 to 2010 and 2010 to 2020, respectively. From 2000 to 2010, the average annual growth rate of permanent population in Gu'an County, Xianghe County, Dachang County and Sanhe City under the jurisdiction of Langfang, which is close to Beijing, was 0.5%, 1.1%, 0.5% and 3.6%, respectively, and increased to 3.2%, 2.7%, 3.8% and 4% respectively from 2010 to 2020.
Second, under the condition that the original industrial advantages are obvious, the eastern coastal areas are still more attractive to labor, and the population inflow of Zhejiang, Fujian, and Jiangsu has increased significantly. In the past 10 years, the long-term industrial and economic advantages accumulated in the eastern coastal areas of the mainland are still attractive to labor, which affects the choice of labor flow areas. Excluding Beijing, Tianjin, Shanghai and Xinjiang and Tibet, where there are many missing data, the proportion of population inflow from 2010 to 2020 increased by 6 compared with 2000 to 2010, of which Hubei and Zhejiang both increased by more than 11 percentage points, Fujian and Jiangsu increased by 7.8 and 7.4 percentage points respectively, while the proportion of population inflow in most areas decreased. However, in the future, with the completion of the return of migrant workers and industrial transfer, as well as the siphoning effect of the core cities in the central and western regions on the population of the region, it is expected that the number of population outflow areas in these central and western provinces will continue to increase.
3.3 Prospects and enlightenment of Chinese population mobility: people go with industry, and people go to higher places
1) In the future, the population will continue to concentrate in the metropolitan areas of first- and second-tier cities and some regional central cities, and the population inflow areas are also the most economically dynamic areas in China in the past, present and future. People go with the industry, people go to high places is the basic logic of population flow, that is, the distribution of economy and population is balanced, and the population flow makes the regional economy-population ratio gradually close to 1, that is, the per capita income gap between regions is gradually narrowed. In the industrial age, industrial development required agglomeration, which led to a large-scale migration of people from rural to urban areas. In the post-industrial era, because the development of the service industry requires more agglomeration than industry, the population mainly migrates to central cities and metropolitan areas in the middle and late stages of urbanization.
From the experience of population movement in the world and in developed economies such as the United States and Japan, the trend of population agglomeration to first- and second-tier metropolitan areas and some regional central cities is irreversible, and this trend will continue in the future, and the places where the population flows into China are also the most economically dynamic regions in the past, present and future. At present, the siphon effect of core cities in most metropolitan areas in China is still obvious, but with the development and maturity, it will gradually turn into a spillover effect, spilling over capital, technology, industry, population, etc., to promote the development of small and medium-sized cities within the metropolitan area.
2) The construction of county-level areas adjacent to metropolitan urban agglomerations may be another focus of future development. For example, in recent years, the development of counties around big cities has accelerated and become satellite cities of big cities, such as Gu'an County, Xianghe County, and Dachang County under the jurisdiction of Langfang, which are close to Beijing. With the further optimization and improvement of transportation and commuting, public functions, supporting industries, etc., the county seat adjacent to the metropolitan urban agglomeration is expected to become a new choice for population flow, which is quite beneficial to the balanced development of urban and rural areas in the mainland. In May this year, the central government issued the "Opinions on Promoting Urbanization Construction with County Towns as Important Carriers", which put forward the work requirements, development goals and specific measures for county construction, and the main idea is in line with the "Key Tasks of New Urbanization and Urban-Rural Integration Development in 2022". On the whole, the proposal of one county and one policy to promote urbanization construction may better serve the construction of a unified national market, create more employment opportunities in the county, and stimulate the economic vitality of the county. However, some county areas are located in remote areas, and due to location and other factors, there are fewer development opportunities.
3) For the real estate market, the traditional judgment that population inflow is directly related to the increase in demand for home ownership needs to be further deepened, and the regions with a young population structure and a significant increase in the permanent population and primary school students are better. Under the background of individual homogenization and the policy of purchase restriction without household registration, the housing demand of the permanent resident population and the registered population is the same, and the inflow of permanent resident population and the inflow of the registered population are the same, but this is not the case in real life, and the income of the permanent resident migrant population is low and is restricted by the regional housing purchase restriction policy. In addition, the age structure of the population also has a significant impact on the demand for housing purchases, and from the perspective of the housing demand curve of various countries, the population aged 20-50 is generally the main group of home buyers. Therefore, the research on the demand for housing needs to be further deepened, not only to analyze the permanent population, but also to analyze the primary school students, but also to analyze the age structure.
4) Deepen and promote the reform of the household registration system and the land system, and further eliminate the shackles of free movement of population. Although the reform of the household registration system is deepened, the restrictions on settlement in large cities are still obvious, which restricts the population agglomeration in large cities, which is not conducive to giving full play to the agglomeration effect and promoting the development of the service industry. In the past two years, under the background of population decline and aging, high-quality development, land finance, etc., the urban "war for talent" for talents and young population has been hotly launched, and the inclusiveness of household registration system and public service resources in major cities to the foreign population has been significantly enhanced, but more importantly, it is more important to "retain people" through the development of industries and the improvement of public services after "grabbing people". Moreover, low-income people are equally important to urban development, and if there are not enough low-income people, the cost of urban production and living will also rise, which will also form a constraint on middle- and high-income people.
5) Reform the "man-land linkage" with the increase of permanent population as the core to optimize land supply. In the future, we should adhere to the strategy of urban agglomeration in the metropolitan area, and link the new permanent population with land supply, and link the balance of cultivated land occupation and compensation across provinces with the increase and decrease of urban and rural land, such as the index of land for sale in the northeast and western regions, which can effectively solve the problem of a large amount of waste of land use indicators in the northeast and west, as well as the shortage of land use indicators in the southeast coast. Strictly implement the principle of "linking the inventory destocking cycle with land supply" to optimize the current land supply model. Enrich the supply forms of commercial housing, rental housing, co-ownership housing and other categories, and form a multi-party supply pattern of the government, developers, leasing intermediary companies, long-term rental companies and other parties.
According to our research in "Where Housing Prices Are Well Controlled: Changsha Chapter", Changsha's housing prices, house-price-to-income ratio, and growth rate are at a low level in major cities against the backdrop of soaring housing prices in most first- and second-tier cities across the country. In 2021, the average price of second-hand houses in Changsha was 11,000 yuan/square meter, lower than that of second-tier cities such as Wuhan, Zhengzhou, and Nanchang, and the house-price-to-income ratio in Changsha remained at 6-7 in the past 10 years, which was at the lower level of the country, and the average annual growth rate of commercial housing in Changsha in the past 10 years was less than 9.4%, lower than that of most second-tier cities. The reason for the good regulation of Changsha's real estate is that Changsha is a typical multi-center group spatial structure, with a large land supply, and strictly limits the premium rate of land transactions, and sets the price composition of "cost + profit + tax" for commercial housing, which not only ensures a certain profit space for real estate enterprises, but also ensures that housing prices are relatively stable.
6) Maintain long-term stability of monetary policy and real estate financial policy. According to our research in our monograph Global Real Estate, "over-financialization of real estate" is a source of risk. Implement a long-term and stable housing credit and financial policy to stabilize home buyers' expectations, support rigid demand and improved housing demand, and curb speculative demand. Regulate the financing use of real estate enterprises, prevent excessive financing, and at the same time support the reasonable financing needs of real estate enterprises, and provide a certain time window for real estate enterprises with problems to have the opportunity to save themselves, that is, to clear their own debts.
From Germany's point of view, a neutral and prudent monetary policy and housing finance system are one of the "three pillars" of the long-term stable housing system in Germany. After World War II, the Bundesbank's primary goal was to maintain price stability, strictly self-discipline and not to over-issue currency, Germany's M2 growth rate basically matched the economic growth rate, and the money supply level was reasonable, with M2 accounting for 102.9% of GDP in 2020, which was at a medium level among major developed countries and lower than the average of 126.2% in the euro area. In the context of prudent monetary policy and moderate inflation, German house prices and prices have basically remained stable for a long time, with the nominal house price index rising by 185% and the CPI index rising by 162% from 1970 to 2020, much lower than that of developed countries such as the United States and the United Kingdom in the same period.
7) Steadily promote the pilot of real estate tax. With the end of the era of large-scale development, the land transfer fee and the tax revenue in the transaction link will be reduced in the era of stock housing, and it is the general trend to introduce real estate tax to replace land finance. From international experience, real estate tax is usually used by mature market economies as an important and stable source of local fiscal revenue. In October 2021, the Standing Committee of the National People's Congress authorized the State Council to carry out pilot real estate tax reform in some regions.
However, steady growth is the top priority of the macro economy this year. The Ministry of Finance said that considering all aspects of the situation, it does not have the conditions to expand the pilot cities for real estate tax reform this year. In the future, it is necessary to establish a scientific economic model to evaluate the impact of real estate tax on all parties.