- 0x01 Prometheus 安裝異常整理
- 問題1.通路node_exporter程式的9100的/metrics提示context deadline exceeded錯誤
- 問題2.采用Docker進行prometheus server端安裝報
msg="Failed to create directory for logging active queries"
- 問題3.安裝運作prometheus_server端時顯示
This filesystem is not supported and may lead to data corruption and data loss
- 問題4.使用Prometheus監控外部k8s叢集時提示
x509: certificate signed by unknown authority
- 問題5.使用Prometheus監控外部k8s叢集時提示
cannot list resource \"services\" in API group
- 0x02 Prometheus 使用異常整理
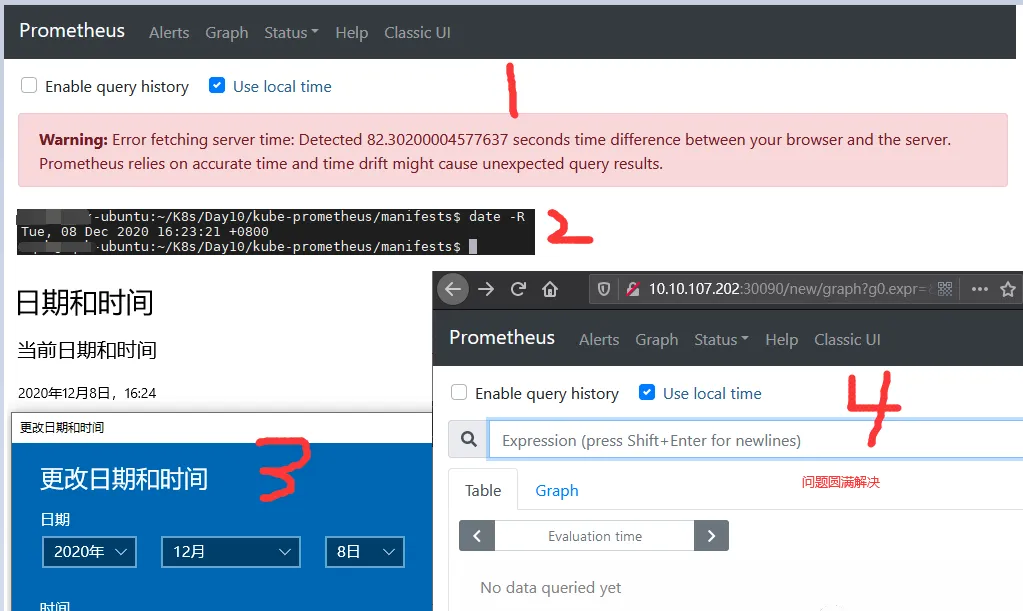
- 問題1.Warning: Error fetching server time: Detected 82.30200004577637 seconds time difference between your browser and the server.
- 問題2.在啟動postgres_exporter監測失敗
- 0x03 AlertManager 使用異常整理
- 問題1.配置使用企業郵箱進行報警時顯示
email.loginAuth failed: 530 Must issue a STARTTLS command first
- 問題2.配置使用企業郵箱進行報警時顯示
starttls failed: x509: certificate signed by unknown authority
- 問題3.郵件預警配置時遇到的錯誤記錄
- 問題4.郵件預警配置使用時報
notify retry canceled after 2 attempts: *email.loginAuth auth: 535 Error:
0x01 Prometheus 安裝異常整理
問題1.通路node_exporter程式的9100的/metrics提示context deadline exceeded錯誤
異常資訊:
Get http://192.168.90.177:9100/metrics: context deadline exceeded
問題原因: 有可能是系統端口未開放。
解決辦法:指定其他端口或者更改防火牆通路政策。
# 解決方式1
nohup ./node_exporter  --web.listen-address=":9100" &

# 解決方式2
# CentOS
firewall-cmd --zone=public --add-port=9100/tcp --permanent #永久生效沒有permanent參數重新開機後失效
firewall-cmd --reload #重新載入配置生效
# Ubuntu
sudo ufw allow 9100
問題2.采用Docker進行prometheus server端安裝報 msg="Failed to create directory for logging active queries"
msg="Failed to create directory for logging active queries"
- 異常資訊: 在持久化映射目錄下沒有
prometheus.yml
$ docker logs prometheus_server
# prometheus_server | level=error ts=2021-04-30T07:50:11.241Z caller=query_logger.go:109 component=activeQueryTracker msg="Failed to create directory for logging active queries"
# prometheus_server | level=error ts=2021-04-30T07:50:11.241Z caller=query_logger.go:87 component=activeQueryTracker msg="Error opening query log file" file=data/queries.active err="open data/queries.active: no such file or directory"
# prometheus_server | panic: Unable to create mmap-ed active query log
# component=activeQueryTracker msg="Error opening query log file" file=/prometheus/queries.active err="open /prometheus/queries.active: permission denied"
# panic: Unable to create mmap-ed active query log - 解決辦法: 在映射的持久化目錄下建立
prometheus.yml
chmod +777 /nfsdisk-31/monitor/prometheus
docker run -p 9090:9090 -v /tmp/prometheus.yml:/etc/prometheus/prometheus.yml \
  -v /nfsdisk-31/monitor/prometheus:/prometheus \
  prom/prometheus
Tips : 注意 Prometheus 2.x 版本容器的資料目錄是
/prometheus而非/prometheus-data
目錄;
問題3.安裝運作prometheus_server端時顯示 This filesystem is not supported and may lead to data corruption and data loss
This filesystem is not supported and may lead to data corruption and data loss
異常資訊: 由于prometheus包括本地磁盤時間序列資料庫,但也可以選擇與遠端存儲系統內建,此檔案系統不受支援可能導緻資料損壞和資料丢失。
prometheus_server | level=warn ts=2021-05-10T05:46:49.843Z caller=main.go:813 fs_type=NFS_SUPER_MAGIC msg="This filesystem is not supported and may lead to data corruption and data loss. Please carefully read https://prometheus.io/docs/prometheus/latest/storage/ to learn more about supported filesystems." 異常原因: Prometheus的本地存儲不支援不相容POSIX的檔案系統,因為可能會發生不可恢複的損壞。不支援NFS檔案系統(包括AWS的EFS)。NFS可能符合POSIX,但大多數實作均不符合。強烈建議使用本地檔案系統以提高可靠性,是以此種共享存儲檔案的方式不推薦。
解決辦法: 如果您的本地存儲由于某種原因而損壞,解決該問題的最佳政策是關閉Prometheus,然後删除整個存儲目錄,您也可以嘗試删除單個塊目錄或WAL目錄以解決問題。如果資料沒問題隻是報警你使用了NFS共享存儲檔案的格式建議采用
FC SAN 存儲直連
或者加大磁盤存儲空間。
問題4.使用Prometheus監控外部k8s叢集時提示 x509: certificate signed by unknown authority
x509: certificate signed by unknown authority
異常資訊:
prometheus_server | level=error ts=2021-05-10T05:43:12.126Z caller=klog.go:96 component=k8s_client_runtime func=ErrorDepth msg="pkg/mod/k8s.io/[email protected]/tools/cache/reflector.go:167: Failed to watch *v1.Pod: failed to list *v1.Pod: Get \"https://k8s-dev.weiyigeek:6443/api/v1/pods?limit=500&resourceVersion=0\": x509: certificate signed by unknown authority" 解決辦法: 在prometheus.yaml主配置中在kubernetes_sd_file對象内的使用
insecure_skip_verify: true
來跳過 tls 驗證。
tls_config:
insecure_skip_verify: true 問題5.使用Prometheus監控外部k8s叢集時提示 cannot list resource \"services\" in API group
cannot list resource \"services\" in API group
異常資訊:
prometheus_server | level=error ts=2021-05-10T09:09:30.960Z caller=klog.go:96 component=k8s_client_runtime func=ErrorDepth msg="pkg/mod/k8s.io/[email protected]/tools/cache/reflector.go:167: Failed to watch *v1.Service: failed to list *v1.Service: services is forbidden: User \"system:serviceaccount:default:prometheus\" cannot list resource \"services\" in API group \"\" at the cluster scope" 問題原因: 目前Token所屬prometheus使用者無該services檢視浏覽權限需要在
ClsuterRole
進行添加相對應的權限。
kubectl get clusterrole prometheus -o yaml # 采用yaml格式檢視其權限叢集角色權限
# NAME         CREATED AT
# prometheus   2021-05-14T08:29:08Z
0x02 Prometheus 使用異常整理
問題1.Warning: Error fetching server time: Detected 82.30200004577637 seconds time difference between your browser and the server.
- 異常資訊: 伺服器時間:檢測到您的浏覽器和伺服器之間有82.30200004577637秒的時間差。Prometheus依賴于精确的時間,而時間漂移可能會導緻意外的查詢結果。
- 問題原因: 伺服器的時間與本地時間不一緻進而導緻, PS 在 Prometheus web 中偏差大于 5 min 時,無法查詢到任何資料,當時間偏差小于 5min 時,可以查到資料,并且正常在 Grafana 中顯示。
- 解決辦法: 伺服器時間與本機時間設定一緻即可;
n.Prometheus監控之所遇問題解決總結
問題2.在啟動postgres_exporter監測失敗
解決辦法: 在啟動postgres_exporter的Linux使用者下加入
DATA_SOURCE_NAME
環境變量
# 環境變量添加
tee -a ~/.bash_profile <<'EOF'
export DATA_SOURCE_NAME="postgresql://postgres:[email protected]:5432/postgres?sslmode=disable"
EOF

# 環境變量生效
source .bash_profile && echo $DATA_SOURCE_NAME

# 啟動 postgres 導出器
./postgres_exporter
0x03 AlertManager 使用異常整理
問題1.配置使用企業郵箱進行報警時顯示 email.loginAuth failed: 530 Must issue a STARTTLS command first
email.loginAuth failed: 530 Must issue a STARTTLS command first
問題原因: 接入的郵件伺服器必須使用tls并且進行有效身份校驗。
解決辦法:
smtp_require_tls: true 問題2.配置使用企業郵箱進行報警時顯示 starttls failed: x509: certificate signed by unknown authority
starttls failed: x509: certificate signed by unknown authority
問題原因: 未知機構簽署的證書即用戶端通路服務端時證書不受信賴
解決辦法: 需要在
email_configs
下配置 insecure_skip_verify: true 來跳過 tls 驗證
receivers:
- name: 'default-email'
  email_configs:
  - to: '[email protected]'
    insecure_skip_verify: true
    send_resolved: true
問題3.郵件預警配置時遇到的錯誤記錄
# - 當在global配置 smtp.weiyigeek.top:25
報錯資訊:
level=error ts=2020-04-08T06:02:44.036Z caller=notify.go:372 component=dispatcher msg=“Error on notify” err=“send STARTTLS command: x509: certificate is valid for *.mxhichina.com, mxhichina.com, not smtp.weiyigeek.top” context_err=“context deadline exceeded”
level=error ts=2020-04-08T06:02:44.036Z caller=dispatch.go:301 component=dispatcher msg=“Notify for alerts failed” num_alerts=1 err=“send STARTTLS command: x509: certificate is valid for *.mxhichina.com, mxhichina.com, not smtp.weiyigeek.top”

# - 當在global配置
# smtp.weiyigeek.top
# smtp_require_tls:false
報錯資訊:
level=warn ts=2020-10-12T10:34:11.780Z caller=notify.go:674 component=dispatcher receiver=mail-receiver integration=email[0] msg=“Notify attempt failed, will retry later” attempts=1 err="*smtp.plainAuth auth: unencrypted connection"
level=error ts=2020-10-12T10:34:21.581Z caller=dispatch.go:309 component=dispatcher msg=“Notify for alerts failed” num_alerts=1 err=“mail-receiver/email[0]: notify retry canceled after 7 attempts: *smtp.plainAuth auth: unencrypted connection”

# - 配置smtp.qiye.aliyun.com:465
報錯資訊:
level=warn ts=2020-10-12T11:36:41.779Z caller=notify.go:674 component=dispatcher receiver=mail-receiver integration=email[0] msg=“Notify attempt failed, will retry later” attempts=1 err="‘require_tls’ is true (default) but “smtp.qiye.aliyun.com:465” does not advertise the STARTTLS extension"
level=error ts=2020-10-12T11:36:51.578Z caller=dispatch.go:309 component=dispatcher msg=“Notify for alerts failed” num_alerts=1 err=“mail-receiver/email[0]: notify retry canceled after 8 attempts: ‘require_tls’ is true (default) but “smtp.qiye.aliyun.com:465” does not advertise the STARTTLS extension”tail: /opt/logs/alertmanager-9093.log: file truncated
解決辦法: 配置以下兩行發送郵件正常
smtp.qiye.aliyun.com:465
smtp_require_tls: false 問題4.郵件預警配置使用時報 notify retry canceled after 2 attempts: *email.loginAuth auth: 535 Error:
notify retry canceled after 2 attempts: *email.loginAuth auth: 535 Error:
錯誤資訊:
level=error ts=2021-05-20T14:34:43.637Z caller=dispatch.go:309 component=dispatcher msg="Notify for alerts failed" num_alerts=2 err="default-email/email[0]: notify retry canceled after 2 attempts: *email.loginAuth auth: 535 Error: \ufffd\ufffdʹ\ufffd\ufffd\ufffd\ufffdȨ\ufffd\ufffd\ufffd\ufffd¼\ufffd\ufffd\ufffd\ufffd\ufffd\ufffd\ufffd뿴: http://service.mail.qq.com/cgi-bin/help?subtype=1&&id=28&&no=1001256" 錯誤原因: 郵箱認證密碼未采用用于登入第三方用戶端的專用密碼或者設定的tmpl模闆路徑不正确,此時隻需按照上述的位址進行申請發信郵箱的專用密碼。(實際測試發現QQ郵箱必須要使用第三方專用密碼,而企業郵箱可以直接用登陸密碼進行認證
不推薦
)
- 0x00 前言簡述
- 0x01 AlertManager之郵件告警
- 1.配置并使用騰訊企業郵箱進行郵件發送警告
- 2.配置并使用自定義郵箱報警樣式模闆
- 3.配置并使用企業微信發送報警通知
- 0x02 實作Prometheus安全認證配置
0x00 前言簡述
描述: Prometheus 告警分為兩個部分進行實作監控規則比對以及告警資訊的通知。
- 首先需要在
Prometheus
- 其次
Alertmanager
告警狀态
Prometheus Alert 告警狀态有三種狀态:
Inactive、Pending、Firing
。
- Inactive:非活動狀态,表示正在監控,但是還未有任何警報觸發。
- Pending:表示這個警報必須被觸發。由于警報可以被分組、壓抑/抑制或靜默/靜音,是以等待驗證,一旦所有的驗證都通過,則将轉到 Firing 狀态。
- Firing:将警報發送到 AlertManager,它将按照配置将警報的發送給所有接收者。一旦警報解除則将狀态轉到 Inactive如此循環。
參考來源
- https://prometheus.io/docs/alerting/configuration/
0x01 AlertManager之郵件告警
描述: 在前面幾章的學習中都沒有講解AlertManager報警管理系統的使用,部落客專門把他放在本章進行講解,因為其實作報警通知的方式有多種多樣。
Email_config 配置參考: https://prometheus.io/docs/alerting/latest/configuration/#email_config
# - 注意此處非全局是以沒有smtp字首
# Whether or not to notify about resolved alerts.
[ send_resolved: <boolean> | default = false ]

# The email address to send notifications to.
to: <tmpl_string>

# The sender address.
[ from: <tmpl_string> | default = global.smtp_from ]

# The SMTP host through which emails are sent.
[ smarthost: <string> | default = global.smtp_smarthost ]

# The hostname to identify to the SMTP server.
[ hello: <string> | default = global.smtp_hello ]

# SMTP authentication information.
[ auth_username: <string> | default = global.smtp_auth_username ]
[ auth_password: <secret> | default = global.smtp_auth_password ]
[ auth_secret: <secret> | default = global.smtp_auth_secret ]
[ auth_identity: <string> | default = global.smtp_auth_identity ]

# The SMTP TLS requirement.
# Note that Go does not support unencrypted connections to remote SMTP endpoints.
[ require_tls: <bool> | default = global.smtp_require_tls ]

# TLS configuration.
tls_config:
[ <tls_config> ]

# The HTML body of the email notification.
[ html: <tmpl_string> | default = '{{ template "email.default.html" . }}' ]
# The text body of the email notification.
[ text: <tmpl_string> ]

# Further headers email header key/value pairs. Overrides any headers
# previously set by the notification implementation.
[ headers: { <string>: <tmpl_string>, ... } ]
實踐目标:
- 1.配置并使用騰訊企業郵箱進行郵件發送警告
- 2.配置并使用自定義郵箱報警樣式模闆
- 3.配置并使用企業微信發送報警通知
1.配置并使用騰訊企業郵箱進行郵件發送警告
- Step 1.首先我們需要配置 Prometheus.yml 抓取目标、加載規則檔案,并與Alertmanager通信設定。
global:
  scrape_interval: 2m
  scrape_timeout: 10s
# - 每分鐘進行報警規則的評估 (建議根據實際情況進行修改)
  evaluation_interval: 1m
  external_labels:
    monitor: 'prom-demo'

alerting:
# - 設定報警管理系統的目标位址 (可以配置多個AlertManager)
  alertmanagers:
  - scheme: http
    static_configs:
    - targets:
      - '192.168.12.107:30093'

rule_files:
# - 名額監控告警規則 (可以根據不同的場景進行報警規則)
  - /etc/prometheus/conf.d/rules/*.rules

# - 采集監控的靜态目标和自動化發現目标
scrape_configs:
  - job_name: 'prom-Server'
    static_configs:
      - targets: ['localhost:9090']
  - job_name: 'cAdvisor'
    static_configs:
      - targets: ['192.168.12.111:9100']
  - job_name: 'linux_exporter'
    scrape_interval: 30s
    file_sd_configs:
    - files:
      - /etc/prometheus/conf.d/discovery/k8s_nodes.yaml
# - 自動重新整理自動發現配置檔案
refresh_interval: 1m - Step 2.配置 Prometheus 報警規則此次判斷采集節點的狀态和節點主機負載情況
tee alert.rules <<'EOF'
groups:
- name: node-normal
  rules:
  - alert: service_down
    expr: up {job="linux_exporter"} == 0
    # - 對于持續時間的設定在實際環境中至少建議5min,以減少噪聲進而減輕固有監控各種情況,此處設定為30s便于報警情況的觀察。
    for: 30s
    labels:
      severity: 'critical'
      team: node
    annotations:
      summary: "主機 {{ $labels.instance }} 監控服務已停止運作超過 15s!"
      description: "請系統管理者盡快進行人工幹預處理!"
  - alert: high_load
    expr: node_load1 > 0.7
    for: 5m
    labels:
      severity: 'warning'
      team: node
    annotations:
      summary: "主機 {{ $labels.instance }} 高負載大于0.7以上運作超過 5m!"
EOF
Tips
: 說明一下該 rules 目的是監測 node 是否存活 expr 為 PromQL 表達式驗證特定節點
job="linux_exporter" 是否活着,for 表示報警狀态為 Pending 後等待 30s 變成 Firing 狀态,一旦變成
Firing 狀态則将報警發送到 AlertManager 并且 labels (
标簽
)和 annotations(
注釋
) 對該 alert 添加更多的辨別和注解資訊。
- Step 3.配置 Alertmanager 報警通知,此時配置騰訊企業郵箱的方式進行郵件發送報警。
tee alertmanager.yaml <<'EOF'
# - 全局配置
global:
  resolve_timeout: 5m
  smtp_from: '[email protected]'
  # - 企業郵箱 SMTP 服務位址
  smtp_smarthost: 'smtp.exmail.qq.com:465'
  smtp_auth_username: '[email protected]'
  # - 第三方登入企業郵箱的授權碼
  smtp_auth_password: xxxxxxxxxxx'
  smtp_require_tls: false
  # smtp_hello: 'qq.com'
# - 設定報警的分發政策
route:
  group_by: ['alertname']
  group_wait: 30s
  group_interval: 1m
  # - 如果在10分鐘内還未解除報警則進行發送告警
  repeat_interval: 10m
  receiver: 'default-email'
# -  配置告警消息接受者資訊
receivers:
- name: 'default-email'
  email_configs:
  - to: '[email protected]'
    send_resolved: true
# - 抑制規則配置
inhibit_rules:
  - source_match:
      severity: 'critical'
    target_match:
      severity: 'warning'
    equal: ['alertname', 'instance']
EOF -
Step
4.重新開機Prometheus和Alertmanager服務,同時關閉一台node進行觸發報警發送 Email,上邊我們定義的 rule
規則為監測 job="linux_exporter" Node 是否活着,那麼就可以停掉 node-exporter 服務來間接起到 Node
Down 的作用,進而達到報警條件,觸發報警規則。
# - 重新開機容器
docker restart prometheus_alertmanager prometheus_server

# - 關閉192.168.12.109機器的node_exporter服務
ssh -p 20211 weiyigeek@weiyigeek-109 "sudo -S systemctl stop node_exporter.service"
[sudo] password for weiyigeek: - Step 5.效果檢視及報警流程說明,關閉後等待prometheus定時拉取各job的任務執行,其次我們可以在
Targets
linux_exporter
192.168.12.109
的節點狀态是否變成了DOWN,等待
30s 後,alert 頁面由綠色 Service_down (0 active) Inactive 狀态變成了黃色 Service_down
(1 active) Pending 狀态,繼續等待 30s 後狀态變成紅色 Firing 狀态,向 AlertManager
發送報警資訊,此時 AlertManager 則按照配置規則向接受者發送郵件告警。
linux_exporter (5/6 up)
Endpoint  State  Error
http://192.168.12.109:9100/metrics DOWN Get "http://192.168.12.109:9100/metrics": dial tcp 192.168.12.109:9100: connect: connection refused 
- Step 6.我們在 AlertManager 檢視發送報警資訊以及發送的報警郵箱,可以看到接收到的報警包含該節點的标簽以及我們添加的
Annotations
n.Prometheus監控之所遇問題解決總結 - Step 7.然後我們将
192.168.12.109
Service_down (0 active) Inactive
ssh -p 20211 weiyigeek@weiyigeek-109 "sudo -S systemctl start node_exporter.service" Tips
: 每次停止/恢複服務後 30s 之後才會發現 Alert 狀态變化,是因為 prometheus.yml中 global ->
scrape_interval: 30s 配置決定的,如果覺得等待 30s 時間太長,可以修改小一些可以全局修改,也可以局部修改。例如s上面就行采用局部修改 linux_exporter 等待時間為 30s。
2.配置并使用自定義郵箱報警樣式模闆
描述: 雖然預設的郵件報警樣式模闆已經包含了所有核心的資訊,但是郵件格式内容可以更優雅直覺一些,同時AlertManager 也是支援自定義郵件模闆配置的。
- Step 1.首先建立一個模闆檔案 email.tmpl
tee email.tmpl<<'EOF'
{{ define "email.from" }}[email protected]{{ end }}
{{ define "email.to" }}[email protected]{{ end }}
{{ define "email.to.html" }}
{{ range .Alerts }}
<b>=========start==========</b><br>
告警程式: prometheus_alert <br>
告警級别: {{ .Labels.severity }} 級 <br>
告警類型: {{ .Labels.alertname }} <br>
故障主機: {{ .Labels.instance }} <br>
告警主題: {{ .Annotations.summary }} <br>
告警詳情: {{ .Annotations.description }} <br>
觸發時間: {{ .StartsAt.Format "2006-01-02 15:04:05" }} <br>
<b>=========end==========</b><br>
{{ end }}
{{ end }}
EOF
Tips : 注意上述的.StartsAt.Format的格式化字元必須是"2006-01-02 15:04:05",否則報警的時間不對。
- Step 2.其次在AlertManager主配置檔案中引用模闆及其定義
tee alertmanager.yaml <<'EOF'
global:
resolve_timeout: 5m
smtp_from: '[email protected]'
smtp_smarthost: 'smtp.exmail.qq.com:465'
smtp_auth_username: '[email protected]'
smtp_auth_password: 'xxxxxxxxxxxxxxx'
smtp_require_tls: false
# smtp_hello: 'qq.com'

# - Tips 上面的全局郵件參數無法從email.tmpl中讀取{{ template "email.username" . }}坑(排錯一下午)
templates:
- '/alertmanager/email.tmpl'

route:
group_by: ['alertname']
group_wait: 30s
group_interval: 1m
repeat_interval: 10m
receiver: 'default-email'

receivers:
- name: 'default-email'
email_configs:
- to: '{{ template "email.to" . }}'
html: '{{ template "email.to.html" . }}'
# 如果問題已解決将發送資訊如設定false則不發送
send_resolved: true

inhibit_rules:
- source_match:
severity: 'critical'
target_match:
severity: 'warning'
equal: ['alertname', 'instance']
EOF
Tips : 全局中的郵件參數無法從
email.tmpl
中讀取定義的模闆參數,例如
{{ template "email.username" . }}
坑(排錯一下午)隻有以下對象可以讀取:
email_config:
  - to: <tmpl_string>
    from: <tmpl_string>
    html: <tmpl_string>  | text: <tmpl_string>  '{{ template "email.default.html" . }}'
Tips : 官方email_config配置參考位址(https://prometheus.io/docs/alerting/latest/configuration/#email_config)
- Step 3.重新開機alertmanager服務
docker restart prometheus_alertmanager
192.168.12.109
ssh -p 20211 weiyigeek@weiyigeek-109 "sudo -S systemctl stop node_exporter.service"
- Step 4.至此自定義的Email通知模闆的使用到此結束,但是此模闆還有不夠完善的地方例如當計算機恢複後的通知資訊沒有進行判斷。
3.配置并使用企業微信發送報警通知
描述: Alertmanager 已經内置了對企業微信的支援,我們可以通過企業微信來管理報警,更進一步可以通過企業微信和微信的互通來直接将告警消息轉發到個人微信上,在前面的Alertmanager.yaml配置檔案參數進行了解也可以從prometheus的官網 中給出了企業微信的相關配置說明如下:
# Whether or not to notify about resolved alerts.
[ send_resolved: <boolean> | default = false ]

# The WeChat API URL.
[ api_url: <string> | default = global.wechat_api_url ]

# 企業微信賬号唯一 ID, 可以在我的企業中檢視。
[ corp_id: <string> | default = global.wechat_api_corp_id ]
# 第三方企業應用的密鑰,可以在自己建立的第三方企業應用詳情頁面檢視。
[ api_secret: <secret> | default = global.wechat_api_secret ]
# 第三方企業應用的 ID,可以在自己建立的第三方企業應用詳情頁面檢視。
[ agent_id: <string> | default = '{{ template "wechat.default.agent_id" . }}' ]
# 在背景通訊錄檢視需要發送的組的部門ID ( PartyID1 | PartyID2)
[ to_party: <string> | default = '{{ template "wechat.default.to_party" . }}' ]
# 發送的成員 @all 表示所有的成員
[ to_user: <string> | default = '{{ template "wechat.default.to_user" . }}' ]
# 發送給特點 tag 标記的,
[ to_tag: <string> | default = '{{ template "wechat.default.to_tag" . }}' ]
#
[ message: <tmpl_string> | default = '{{ template "wechat.default.message" . }}' ]
Tips
:
企業微信相關概念說明請參考[企業微信API說明](https://work.weixin.qq.com/api/doc#90000/90135/90665),可以在企業微信的背景中建立多個應用,每個應用對應不同的報警分組,由企業微信來做接收成員的劃分。
操作流程步驟:
- Step 1.通路企業微信網站有賬号的直接掃碼登陸如果沒有就注冊一個即可,登陸後通路企業應用進行建立自建應用,點選建立應用按鈕->填寫應用相關資訊(包括應用名稱、或應用介紹以及可用範圍)。
- Step 2.檢視的獲得 AgentId 以及 Secret 将其記錄下來以及部門
ID:to_party
AlertManager.yml
# - 例如:部落客的AgentId和Secret的格式如下
企業ID: ww32cf0bf4e4b11487
agent_id: 1000002
api_secret: SYCdXbWj5SjdT9pOSQnjIZ4RF_SIRqERVuZNWE1yE5g
to_party: 1 - Step 3.編輯Alertmanager.yaml主配置檔案設定企業微信通知相關參數。
tee alertmanager.yaml <<'EOF'
global:
  resolve_timeout: 2m

templates:
- '/alertmanager/*.tmpl'

route:
  group_by: ['alertname']
  group_wait: 30s
  group_interval: 1m
  repeat_interval: 10m
  receiver: 'wechat'

receivers:
- name: 'default-email'
  email_configs:
  - from: '[email protected]'
    smarthost: 'smtp.exmail.qq.com:465'
    auth_username: '[email protected]'
    auth_password: 'xxxxxxxxxxxxxxx'
    require_tls: false
    # smtp_hello: 'qq.com'
    to: '{{ template "email.to" . }}'
    html: '{{ template "email.to.html" . }}'
    send_resolved: true

- name: 'wechat'
  wechat_configs:
  - send_resolved: true
    api_url: 'https://qyapi.weixin.qq.com/cgi-bin/'
    corp_id: 'ww32cf0bf4e4b11487'
    agent_id: '1000002'
    api_secret: 'SYCdXbWj5SjdT9pOSQnjIZ4RF_SIRqERVuZNWE1yE5g'
    to_user: '@all'
    to_party: '1'
    message: '{{ template "wechat.default.message" . }}'

inhibit_rules:
- source_match:
    severity: 'critical'
  target_match:
    severity: 'warning'
  equal: ['alertname', 'instance']
EOF - Step 4.重新開機Alertmanager服務
docker restart prometheus_alertmanager
- Step 5.采用自定義的Wechat報警子產品(包括Firing和Resolved)的資訊通知
tee wechat.tmpl <<'EOF'
{{ define "wechat.default.message" }}
{{- if gt (len .Alerts.Firing) 0 -}}
{{- range $index, $alert := .Alerts -}}
{{- if eq $index 0 -}}
告警類型: {{ $alert.Labels.alertname }}
告警級别: {{ $alert.Labels.severity }}
=====================
{{- end }}
===告警詳情===
告警詳情: {{ $alert.Annotations.summary }}
告警描述: {{ $alert.Annotations.description }}
故障時間: {{ $alert.StartsAt.Format "2006-01-02 15:04:05" }}
===參考資訊===
{{ if gt (len $alert.Labels.instance) 0 -}}故障執行個體ip: {{ $alert.Labels.instance }};{{- end -}}
{{- if gt (len $alert.Labels.namespace) 0 -}}故障執行個體所在namespace: {{ $alert.Labels.namespace }};{{- end -}}
{{- if gt (len $alert.Labels.node) 0 -}}故障實體機ip: {{ $alert.Labels.node }};{{- end -}}
{{- if gt (len $alert.Labels.pod_name) 0 -}}故障pod名稱: {{ $alert.Labels.pod_name }}{{- end }}
=====================
{{- end }}
{{- end }}

{{- if gt (len .Alerts.Resolved) 0 -}}
{{- range $index, $alert := .Alerts -}}
{{- if eq $index 0 -}}
告警類型: {{ $alert.Labels.alertname }}
告警級别: {{ $alert.Labels.severity }}
=====================
{{- end }}
===告警詳情===
告警詳情: {{ $alert.Annotations.summary }}
故障時間: {{ $alert.StartsAt.Format "2006-01-02 15:04:05" }}
恢複時間: {{ $alert.EndsAt.Format "2006-01-02 15:04:05" }}
===參考資訊===
{{ if gt (len $alert.Labels.instance) 0 -}}故障執行個體ip: {{ $alert.Labels.instance }};{{- end -}}
{{- if gt (len $alert.Labels.namespace) 0 -}}故障執行個體所在namespace: {{ $alert.Labels.namespace }};{{- end -}}
{{- if gt (len $alert.Labels.node) 0 -}}故障實體機ip: {{ $alert.Labels.node }};{{- end -}}
{{- if gt (len $alert.Labels.pod_name) 0 -}}故障pod名稱: {{ $alert.Labels.pod_name }};{{- end }}
=====================
{{- end }}
{{- end }}
{{- end }}
EOF - Step 6.将alertmanager主配置yaml檔案上面
message: '{{ template "wechat.default.message" . }}'
192.168.12.109
# 重新開機
docker restart prometheus_alertmanager
# 日志檢視
docker logs --tail 50 -f prometheus_alertmanager - Step 7.異常告警
(Alerts.Firing)
異常恢複(Alerts.Resolved)
補充說明:
- 1.Wechat 模闆示例學習與改進。
{{ define "wechat.default.message" }}
{{- if gt (len .Alerts.Firing) 0 -}}
{{- range $index, $alert := .Alerts -}}
{{- if eq $index 0 }}
==========異常告警==========
告警類型: {{ $alert.Labels.alertname }}
告警級别: {{ $alert.Labels.severity }}
告警詳情: {{ $alert.Annotations.message }}{{ $alert.Annotations.description}};{{$alert.Annotations.summary}}
故障時間: {{ ($alert.StartsAt.Add 28800e9).Format "2006-01-02 15:04:05" }}
{{- if gt (len $alert.Labels.instance) 0 }}
執行個體資訊: {{ $alert.Labels.instance }}
{{- end }}
{{- if gt (len $alert.Labels.namespace) 0 }}
命名空間: {{ $alert.Labels.namespace }}
{{- end }}
{{- if gt (len $alert.Labels.node) 0 }}
節點資訊: {{ $alert.Labels.node }}
{{- end }}
{{- if gt (len $alert.Labels.pod) 0 }}
執行個體名稱: {{ $alert.Labels.pod }}
{{- end }}
============END============
{{- end }}
{{- end }}
{{- end }}
{{- if gt (len .Alerts.Resolved) 0 -}}
{{- range $index, $alert := .Alerts -}}
{{- if eq $index 0 }}
==========異常恢複==========
告警類型: {{ $alert.Labels.alertname }}
告警級别: {{ $alert.Labels.severity }}
告警詳情: {{ $alert.Annotations.message }}{{ $alert.Annotations.description}};{{$alert.Annotations.summary}}
故障時間: {{ ($alert.StartsAt.Add 28800e9).Format "2006-01-02 15:04:05" }}
恢複時間: {{ ($alert.EndsAt.Add 28800e9).Format "2006-01-02 15:04:05" }}
{{- if gt (len $alert.Labels.instance) 0 }}
執行個體資訊: {{ $alert.Labels.instance }}
{{- end }}
{{- if gt (len $alert.Labels.namespace) 0 }}
命名空間: {{ $alert.Labels.namespace }}
{{- end }}
{{- if gt (len $alert.Labels.node) 0 }}
節點資訊: {{ $alert.Labels.node }}
{{- end }}
{{- if gt (len $alert.Labels.pod) 0 }}
執行個體名稱: {{ $alert.Labels.pod }}
{{- end }}
============END============
{{- end }}
{{- end }}
{{- end }}
{{- end }}
0x02 實作Prometheus安全認證配置
描述: 由于
export
并沒有提供任何認證支援,所需要借助 Nginx 作為反向代理伺服器,添加
HTTP Basic Auth
功能,此時隻有授權的使用者才能采集監控名額, 可以極大避免未授權通路的情況出現。
操作流程
- 1.我們采用Nginx鏡像作為示範搭建與.htpasswd配置生成。
# 鏡像拉取與鏡像運作
docker pull nginx:1.21.0
docker run --name auth -d nginx:1.21.0
docker exec -it auth bash

# 使用 `apache2-utils` 提供的 `htpasswd` 工具建立一個使用者檔案,該鏡像中沒自帶是以我們下載下傳即可
apt install apache2-utils
# 運作 htpasswd 生成一個或多個認證使用者
htpasswd -bc htpasswd.auth weiyigeek password
Adding password for user weiyigeek
htpasswd -b htpasswd.auth prometheus password
Adding password for user prometheus
htpasswd -b htpasswd.auth monitor password
Adding password for user monitor - 2.準備映射到nginx容器中相關檔案
# 拷貝容器中nginx配置
docker cp auth:/etc/nginx /monitor/nginx

# 拷貝生成htpasswd.auth 到主控端
docker cp auth:/tmp/htpasswd.auth /monitor/nginx

# Nginx 配置檔案
root@prometheus:/monitor/nginx/conf# cat conf.d/default.conf
server {
  listen       8080;
  listen  [::]:8080;
  server_name  monitor.weiyigeek.top;

#access_log  /var/log/nginx/host.access.log  main;
  add_header X-Frame-Options SAMEORIGIN;
  auth_basic "weiyigeek Prometheus Metrics";
  auth_basic_user_file /etc/nginx/auth/htpasswd.auth;
#這裡放的是認證檔案位置

  location / {
    proxy_pass http://monitor.weiyigeek.top:9090;
    proxy_redirect          off;
    proxy_set_header        X-Real-IP       $remote_addr;
    proxy_set_header        X-Forwarded-For $proxy_add_x_forwarded_for;
    proxy_set_header        Host            $host;
    proxy_next_upstream error timeout invalid_header http_500 http_502 http_503 http_504 http_404;
    access_log  /var/log/nginx/prometheus_access.log;
}
} - 3.啟動nginx反代容器的參數及狀态檢視
# - 容器啟動
docker run -d --name=prometheus_proxy -p 8080:8080 -v /monitor/nginx/conf:/etc/nginx -v /monitor/nginx/logs:/var/log/nginx/ nginx:1.21.0

# - 容器狀态
docker ps
<!-- CONTAINER ID   IMAGE                   COMMAND                  CREATED         STATUS         PORTS                                               NAMES
6347a6498e69 nginx:1.21.0 "/docker-entrypoint.…" 6 minutes ago Up 6 minutes 80/tcp, 0.0.0.0:8080->8080/tcp, :::8080->8080/tcp prometheus_proxy --> - 4.系統防火牆政策設定(安裝最小通路權限設定)
# 啟動防火牆 & 檢視狀态
systemctl enable ufw && systemctl restart ufw
ufw status && systemctl status ufw

# 允許所有的機器通路 80(Grafana),8080(Nginx Proxy Prometheus Server)
sudo ufw allow proto tcp to port 80,8080

# 可以通過ip addr檢視網卡的網段以便後續docker或者本地通路。
ip addr

# 隻允許從本地和docker0網卡通路 9090,9093,9094,9115 端口
sudo ufw allow proto tcp from 127.0.0.1 to any port 9090,9093,9094,9115
ufw delete allow proto tcp from 172.17.0.1/16 to any port 9090,9093,9094,9115