按照官網的步驟來,一步一個坑,浪費了我一天的時間!多數是因為國内的網絡,下載下傳和拉取速度太慢,導緻安裝失敗。是以寫了這個文章,來記錄我成功安裝的案例,希望可以幫到想用esrally做基準測試的人!
網上也有文章不過都過時了!官網呢,又不适合中國網絡情況的使用。我甚至嚴重懷疑,官網的步驟,他們有沒有執行一遍試試。因為用哪些指令肯定會遇到問題。比如:
sudo yum install git
我不相信這條指令,能幫我們下載下傳新版本的git!
注意目前esrally最新版本是 2.5.0!
官網位址(英文的最新版):Quickstart — Rally 2.5.0 documentation
中文文檔(0.9版本的):安裝 — Rally 0.9.0 文檔
準備環境-需要的環境介紹
我在看文檔的時候,其實蠻想知道我為什麼要安裝這些東西,以及不安裝行不行,我需要安裝什麼版本的。我在看着官網折騰這個的時候浪費了挺多時間,是以特地寫一篇部落格來帶大家避坑!
作業系統 centos7,我是在centos7下安裝的,其它版本,作業系統不适用,其它版本我沒有驗證能否成功。esrally隻能運作在linux下!
安裝過程需要網絡環境。即使有網絡,在裝一些東西的時候依舊有很多問題,是以我在安裝一些東西的時候,也會用安裝包安裝,來減少問題的出現。
另外說一句,esrally文檔是寫給外國人的,因為一些網絡環境我們不具備,是以根據文檔操作,一大堆問題。
想要運作esrally必備的工具
- python3.8以上版本,我看官網的例子是用python3.8.10的版本。為了減少問題,我也用python3.8.10。說一下為什麼要用它,因為esrally是用python寫的,安裝也用到了pip3。這些都屬于必備的!
- git,版本1.9及以上版本。用git是因為es用到的資料都放在了網上,用到的測試用例也放在git上,是以需要我們在用的時候拉取。這個也是必須的,沒有不行!
- JDK。用這個是因為,esrally支援自動建構es叢集,就是幫你搭建叢集。es低版本(7版本之前)并沒有内嵌JDK,是以這些版本需要JDK,并配置好環境。如果你是自建叢集,對已有的叢集進行測試,那就不需要JDK了。如果需要它幫你搭建叢集,你就需要将JDK環境配置好。
- esrally,es基準測試的主角。
如何在linux centos下安裝python環境
這篇文章是我在用esrally的時候寫的,我跟着官網做的時候遇到很多坑,主要是浪費了時間,實在沒必要。我的這個方案更簡單!請看我這篇文章:
centos下編譯安裝各個版本的python_水的精神的部落格
如何更新git,或者說安裝git
centos7預設安裝了git,遺憾的是它的版本是1.8的。也就是低于官網要求的1.9版本。是以需要更新。在網上找文檔折騰的半天,都不靠譜。是以建議看我這篇文章(特簡單,三條指令):
Linux centos下三條指令安裝更新git_水的精神的部落格
如何安裝JDK
下載下傳安裝jdk13
https://www.oracle.com/java/technologies/javase-jdk13-downloads.html 複制
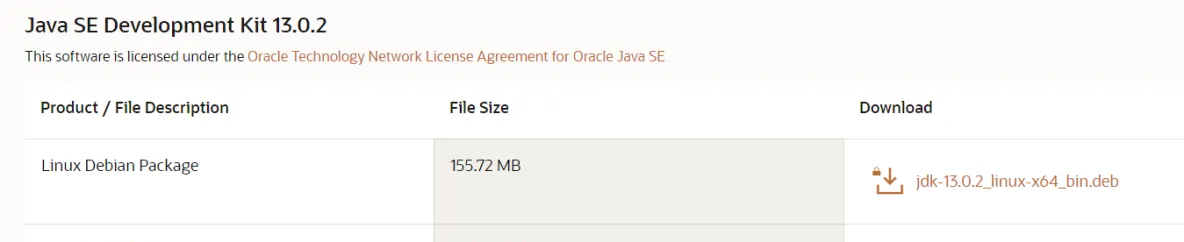
下載下傳,上傳到伺服器上。
然後rpm安裝
rpm -ivh jdk-13.0.2_linux-x64_bin.rpm 配置環境變量,在 /etc/profile檔案的末尾加入以下内容
export JAVA_HOME=/usr/java/jdk-13.0.2
export PATH=$JAVA_HOME/bin:$PATH
export CLASSPATH=.:$JAVA_HOME/lib/dt.jar:$JAVA_HOME/lib/tools.jar
并執行下列指令使環境變量生效
source /etc/profile 安裝esrally
官網給的操作是使用一條指令安裝,開起來很簡單:
pip3 install esrally 但是我執行不成功。可能我對python不是很熟悉的原因把。我用的其它方式來安裝的(離線安裝 esrally 是最靠譜的,解決拉取問題!我在嘗試上邊的指令的時候,遇到了一堆問題。不想解決了!是以用離線的方式來安裝它):
- 安裝上面文檔提到的所有依賴包
- 下載下傳最新釋出的離線包 ,并将它拷貝到目标機器。
- 解壓安裝包
tar -xzf esrally-dist-*.tar.gz
- 執行安裝腳本
sudo ./esrally-dist-*/install.sh
在執行第四條的時候,還是遇到了問題(我把遇到幾個問題貼出來,希望可以幫到你們):
執行 ./install.sh 第一個問題:
ERROR: Could not find a version that satisfies the requirement py-cpuinfo==7.0.0 (from esrally) (from versions: 7.0.0)
ERROR: No matching distribution found for py-cpuinfo==7.0.0

解決指令:
pip3 install py-cpuinfo -i https://pypi.tuna.tsinghua.edu.cn/simple/ --trusted-host pypi.tuna.tsinghua.edu.cn 執行 ./install.sh 第二個問題(python pip相關的問題):
問題
WARNING: You are using pip version 21.1.1; however, version 22.1.2 is available.
You should consider upgrading via the '/usr/local/python38/bin/python3.8 -m pip install --upgrade pip' command.
解決指令:
python3 -m pip install --upgrade pip -i https://pypi.tuna.tsinghua.edu.cn/simple/ --trusted-host pypi.tuna.tsinghua.edu.cn 第三個問題:
解決問題:
pip3 install --upgrade setuptools -i https://pypi.tuna.tsinghua.edu.cn/simple/ --trusted-host pypi.tuna.tsinghua.edu.cn 以上三個問題解決完以後,esrally已經可以成功安裝了!
嘗試運作一下,因為我已經安裝過了es叢集。是以已經可以使用了!
esrally race --track=percolator --target-hosts=10.10.10.10:9200,10.10.10.10:9201,10.10.10.10:9202 --pipeline=benchmark-only esrally --distribution-version=6.0.0 [root@estest esrally-track]# esrally race --track=percolator --target-hosts=10.10.10.10:9200,10.10.10.10:9201,10.10.10.10:9202 --pipeline=benchmark-only
____ ____
/ __ \____ _/ / /_ __
/ /_/ / __ `/ / / / / /
/ _, _/ /_/ / / / /_/ /
/_/ |_|\__,_/_/_/\__, /
/____/
[INFO] Race id is [7f280f60-6b48-41db-9ab3-f6977170c417]
[WARNING] Could not update tracks. Continuing with your locally available state.
[WARNING] Could not update tracks. Continuing with your locally available state.
[INFO] Downloading track data (121.1 kB total size) [100.0%]
[INFO] Decompressing track data from [/root/.rally/benchmarks/data/percolator/queries-2.json.bz2] to [/root/.rally/benchmarks/data/percolator/queries-2.json] (resulting size: [0.1... [OK]
[INFO] Preparing file offset table for [/root/.rally/benchmarks/data/percolator/queries-2.json] ... [OK]
[INFO] Racing on track [percolator], challenge [append-no-conflicts] and car ['external'] with version [6.8.0].
[WARNING] merges_total_time is 8107257 ms indicating that the cluster is not in a defined clean state. Recorded index time metrics may be misleading.
[WARNING] merges_total_throttled_time is 1274256 ms indicating that the cluster is not in a defined clean state. Recorded index time metrics may be misleading.
[WARNING] indexing_total_time is 79966971 ms indicating that the cluster is not in a defined clean state. Recorded index time metrics may be misleading.
[WARNING] refresh_total_time is 3806308 ms indicating that the cluster is not in a defined clean state. Recorded index time metrics may be misleading.
[WARNING] flush_total_time is 522750 ms indicating that the cluster is not in a defined clean state. Recorded index time metrics may be misleading.
Running delete-index [100% done]
Running create-index [100% done]
Running check-cluster-health [100% done]
Running index [100% done]
Running refresh-after-index [100% done]
Running force-merge [100% done]
Running refresh-after-force-merge [100% done]
Running wait-until-merges-finish [100% done]
Running percolator_with_content_president_bush [100% done]
Running percolator_with_content_saddam_hussein [100% done]
Running percolator_with_content_hurricane_katrina [100% done]
Running percolator_with_content_google [100% done]
Running percolator_no_score_with_content_google [100% done]
Running percolator_with_highlighting [100% done]
Running percolator_with_content_ignore_me [100% done]
Running percolator_no_score_with_content_ignore_me [100% done]
------------------------------------------------------
_______ __ _____
/ ____(_)___ ____ _/ / / ___/_________ ________
/ /_ / / __ \/ __ `/ / \__ \/ ___/ __ \/ ___/ _ \
/ __/ / / / / / /_/ / / ___/ / /__/ /_/ / / / __/
/_/ /_/_/ /_/\__,_/_/ /____/\___/\____/_/ \___/
------------------------------------------------------
| Metric | Task | Value | Unit |
|---------------------------------------------------------------:|-------------------------------------------:|--------------:|-------:|
| Cumulative indexing time of primary shards | | 1334.87 | min |
| Min cumulative indexing time across primary shards | | 0.39835 | min |
| Median cumulative indexing time across primary shards | | 15.4366 | min |
| Max cumulative indexing time across primary shards | | 26.0545 | min |
| Cumulative indexing throttle time of primary shards | | 0 | min |
| Min cumulative indexing throttle time across primary shards | | 0 | min |
| Median cumulative indexing throttle time across primary shards | | 0 | min |
| Max cumulative indexing throttle time across primary shards | | 0 | min |
| Cumulative merge time of primary shards | | 135.302 | min |
| Cumulative merge count of primary shards | | 805 | |
| Min cumulative merge time across primary shards | | 0.03545 | min |
| Median cumulative merge time across primary shards | | 1.25905 | min |
| Max cumulative merge time across primary shards | | 8.2117 | min |
| Cumulative merge throttle time of primary shards | | 21.2376 | min |
| Min cumulative merge throttle time across primary shards | | 0 | min |
| Median cumulative merge throttle time across primary shards | | 0 | min |
| Max cumulative merge throttle time across primary shards | | 3.46082 | min |
| Cumulative refresh time of primary shards | | 63.4783 | min |
| Cumulative refresh count of primary shards | | 4067 | |
| Min cumulative refresh time across primary shards | | 0.00725 | min |
| Median cumulative refresh time across primary shards | | 0.758333 | min |
| Max cumulative refresh time across primary shards | | 1.46298 | min |
| Cumulative flush time of primary shards | | 8.7125 | min |
| Cumulative flush count of primary shards | | 233 | |
| Min cumulative flush time across primary shards | | 0 | min |
| Median cumulative flush time across primary shards | | 0.0939167 | min |
| Max cumulative flush time across primary shards | | 0.46015 | min |
| Total Young Gen GC time | | 11.337 | s |
| Total Young Gen GC count | | 777 | |
| Total Old Gen GC time | | 0 | s |
| Total Old Gen GC count | | 0 | |
| Store size | | 84.4625 | GB |
| Translog size | | 2.95658 | GB |
| Heap used for segments | | 172.674 | MB |
| Heap used for doc values | | 0.014431 | MB |
| Heap used for terms | | 141.275 | MB |
| Heap used for norms | | 0.038147 | MB |
| Heap used for points | | 7.70514 | MB |
| Heap used for stored fields | | 23.6414 | MB |
| Segment count | | 85 | |
| Total Ingest Pipeline count | | 0 | |
| Total Ingest Pipeline time | | 0 | s |
| Total Ingest Pipeline failed | | 0 | |
| error rate | index | 0 | % |
| Min Throughput | percolator_with_content_president_bush | 47.9 | ops/s |
| Mean Throughput | percolator_with_content_president_bush | 48.16 | ops/s |
| Median Throughput | percolator_with_content_president_bush | 48.16 | ops/s |
| Max Throughput | percolator_with_content_president_bush | 48.43 | ops/s |
| 50th percentile latency | percolator_with_content_president_bush | 10.2912 | ms |
| 90th percentile latency | percolator_with_content_president_bush | 13.3935 | ms |
| 99th percentile latency | percolator_with_content_president_bush | 16.1495 | ms |
| 100th percentile latency | percolator_with_content_president_bush | 16.4619 | ms |
| 50th percentile service time | percolator_with_content_president_bush | 9.44676 | ms |
| 90th percentile service time | percolator_with_content_president_bush | 12.2333 | ms |
| 99th percentile service time | percolator_with_content_president_bush | 15.5729 | ms |
| 100th percentile service time | percolator_with_content_president_bush | 15.6444 | ms |
| error rate | percolator_with_content_president_bush | 0 | % |
| Min Throughput | percolator_with_content_saddam_hussein | 50.07 | ops/s |
| Mean Throughput | percolator_with_content_saddam_hussein | 50.07 | ops/s |
| Median Throughput | percolator_with_content_saddam_hussein | 50.07 | ops/s |
| Max Throughput | percolator_with_content_saddam_hussein | 50.08 | ops/s |
| 50th percentile latency | percolator_with_content_saddam_hussein | 3.68269 | ms |
| 90th percentile latency | percolator_with_content_saddam_hussein | 4.41383 | ms |
| 99th percentile latency | percolator_with_content_saddam_hussein | 8.45466 | ms |
| 100th percentile latency | percolator_with_content_saddam_hussein | 9.41373 | ms |
| 50th percentile service time | percolator_with_content_saddam_hussein | 2.81123 | ms |
| 90th percentile service time | percolator_with_content_saddam_hussein | 3.50136 | ms |
| 99th percentile service time | percolator_with_content_saddam_hussein | 7.73842 | ms |
| 100th percentile service time | percolator_with_content_saddam_hussein | 8.28083 | ms |
| error rate | percolator_with_content_saddam_hussein | 0 | % |
| Min Throughput | percolator_with_content_hurricane_katrina | 50.13 | ops/s |
| Mean Throughput | percolator_with_content_hurricane_katrina | 50.15 | ops/s |
| Median Throughput | percolator_with_content_hurricane_katrina | 50.15 | ops/s |
| Max Throughput | percolator_with_content_hurricane_katrina | 50.17 | ops/s |
| 50th percentile latency | percolator_with_content_hurricane_katrina | 8.31714 | ms |
| 90th percentile latency | percolator_with_content_hurricane_katrina | 9.77985 | ms |
| 99th percentile latency | percolator_with_content_hurricane_katrina | 11.9031 | ms |
| 100th percentile latency | percolator_with_content_hurricane_katrina | 16.0777 | ms |
| 50th percentile service time | percolator_with_content_hurricane_katrina | 6.9336 | ms |
| 90th percentile service time | percolator_with_content_hurricane_katrina | 8.12209 | ms |
| 99th percentile service time | percolator_with_content_hurricane_katrina | 11.4533 | ms |
| 100th percentile service time | percolator_with_content_hurricane_katrina | 14.9582 | ms |
| error rate | percolator_with_content_hurricane_katrina | 0 | % |
| Min Throughput | percolator_with_content_google | 26.57 | ops/s |
| Mean Throughput | percolator_with_content_google | 26.77 | ops/s |
| Median Throughput | percolator_with_content_google | 26.76 | ops/s |
| Max Throughput | percolator_with_content_google | 26.97 | ops/s |
| 50th percentile latency | percolator_with_content_google | 83.5241 | ms |
| 90th percentile latency | percolator_with_content_google | 104.656 | ms |
| 99th percentile latency | percolator_with_content_google | 115.239 | ms |
| 100th percentile latency | percolator_with_content_google | 119.399 | ms |
| 50th percentile service time | percolator_with_content_google | 34.601 | ms |
| 90th percentile service time | percolator_with_content_google | 44.8482 | ms |
| 99th percentile service time | percolator_with_content_google | 52.8977 | ms |
| 100th percentile service time | percolator_with_content_google | 53.925 | ms |
| error rate | percolator_with_content_google | 0 | % |
| Min Throughput | percolator_no_score_with_content_google | 99.79 | ops/s |
| Mean Throughput | percolator_no_score_with_content_google | 99.79 | ops/s |
| Median Throughput | percolator_no_score_with_content_google | 99.79 | ops/s |
| Max Throughput | percolator_no_score_with_content_google | 99.79 | ops/s |
| 50th percentile latency | percolator_no_score_with_content_google | 3.85806 | ms |
| 90th percentile latency | percolator_no_score_with_content_google | 4.32838 | ms |
| 99th percentile latency | percolator_no_score_with_content_google | 4.84981 | ms |
| 100th percentile latency | percolator_no_score_with_content_google | 5.66612 | ms |
| 50th percentile service time | percolator_no_score_with_content_google | 2.98046 | ms |
| 90th percentile service time | percolator_no_score_with_content_google | 3.37479 | ms |
| 99th percentile service time | percolator_no_score_with_content_google | 4.04749 | ms |
| 100th percentile service time | percolator_no_score_with_content_google | 5.13068 | ms |
| error rate | percolator_no_score_with_content_google | 0 | % |
| Min Throughput | percolator_with_highlighting | 48.79 | ops/s |
| Mean Throughput | percolator_with_highlighting | 48.94 | ops/s |
| Median Throughput | percolator_with_highlighting | 48.94 | ops/s |
| Max Throughput | percolator_with_highlighting | 49.09 | ops/s |
| 50th percentile latency | percolator_with_highlighting | 5.55708 | ms |
| 90th percentile latency | percolator_with_highlighting | 6.13534 | ms |
| 99th percentile latency | percolator_with_highlighting | 10.0739 | ms |
| 100th percentile latency | percolator_with_highlighting | 21.7479 | ms |
| 50th percentile service time | percolator_with_highlighting | 4.72898 | ms |
| 90th percentile service time | percolator_with_highlighting | 5.13776 | ms |
| 99th percentile service time | percolator_with_highlighting | 9.4044 | ms |
| 100th percentile service time | percolator_with_highlighting | 21.1273 | ms |
| error rate | percolator_with_highlighting | 0 | % |
| Min Throughput | percolator_with_content_ignore_me | 0.08 | ops/s |
| Mean Throughput | percolator_with_content_ignore_me | 0.08 | ops/s |
| Median Throughput | percolator_with_content_ignore_me | 0.08 | ops/s |
| Max Throughput | percolator_with_content_ignore_me | 0.08 | ops/s |
| 50th percentile latency | percolator_with_content_ignore_me | 10721.8 | ms |
| 90th percentile latency | percolator_with_content_ignore_me | 11339.3 | ms |
| 99th percentile latency | percolator_with_content_ignore_me | 11920.1 | ms |
| 100th percentile latency | percolator_with_content_ignore_me | 12114.7 | ms |
| 50th percentile service time | percolator_with_content_ignore_me | 10719.2 | ms |
| 90th percentile service time | percolator_with_content_ignore_me | 11337.3 | ms |
| 99th percentile service time | percolator_with_content_ignore_me | 11916.3 | ms |
| 100th percentile service time | percolator_with_content_ignore_me | 12112 | ms |
| error rate | percolator_with_content_ignore_me | 0 | % |
| Min Throughput | percolator_no_score_with_content_ignore_me | 15.03 | ops/s |
| Mean Throughput | percolator_no_score_with_content_ignore_me | 15.05 | ops/s |
| Median Throughput | percolator_no_score_with_content_ignore_me | 15.05 | ops/s |
| Max Throughput | percolator_no_score_with_content_ignore_me | 15.06 | ops/s |
| 50th percentile latency | percolator_no_score_with_content_ignore_me | 31.3156 | ms |
| 90th percentile latency | percolator_no_score_with_content_ignore_me | 50.9371 | ms |
| 99th percentile latency | percolator_no_score_with_content_ignore_me | 58.0967 | ms |
| 100th percentile latency | percolator_no_score_with_content_ignore_me | 58.1975 | ms |
| 50th percentile service time | percolator_no_score_with_content_ignore_me | 30.048 | ms |
| 90th percentile service time | percolator_no_score_with_content_ignore_me | 49.9852 | ms |
| 99th percentile service time | percolator_no_score_with_content_ignore_me | 57.0299 | ms |
| 100th percentile service time | percolator_no_score_with_content_ignore_me | 57.3463 | ms |
| error rate | percolator_no_score_with_content_ignore_me | 0 | % |
[WARNING] No throughput metrics available for [index]. Likely cause: The benchmark ended already during warmup.
----------------------------------
[INFO] SUCCESS (took 1691 seconds)
----------------------------------