1.什麼是拷貝數變異
拷貝數變異(Copy number variation, CNV):基因組發生重排而導緻的,一般指長度1 kb 以上的基因組片段的拷貝數增加或者減少, 主要表現為亞顯微水準的重複或者缺失。是以稱為“微”缺失或重複變異。
人類基因組含有約31.6億個DNA堿基對,組成了23對染色體,每對染色體中一條遺傳自父親,一條遺傳自母親,2條染色體亦稱為同源染色體,大小和基因組成基本一緻,22對為常染色體,還有一對性染色體,女性為XX,男性為XY。正常⼈類基因組成分通常是以2個拷貝存在,分别來⾃⽗母。常染色體和女性X染色體正常拷貝數值為2,男性X和Y染色體正常拷貝數值為1,當拷貝數檢測數值大于正常值時即為重複,小于正常值時為缺失。
CNV在基因組中的存在形式主要有以下⼏種:
- 2條同源染⾊體拷貝數同時出現缺失;
- 1條同源染⾊體發⽣缺失,1條正常;
- 1條同源染⾊體出現拷貝數重複,另1條正常;
- 1條同源染⾊體出現缺失,另1條出現拷貝數重複;
- 2條同源染⾊體同時出現拷貝數重複。
異常的DNA拷貝數變異(CNV)是許多⼈類疾病(如癌症、遺傳性疾病、⼼⾎管疾病)的⼀種重要分⼦機制。作為疾病的⼀項⽣物标志,染⾊體⽔平的缺失、擴增等變化已成為許多疾病研究的熱點,然⽽傳統的⽅法(⽐如G顯帶,FISH,CGH等)存在操作繁瑣,分辨率低等問題,難以提供變異區段的具體資訊,單細胞測序為我們提供了一種新的工具和視野去分析CNV。
2.使用R進行CNV分析
2.1 資料的準備
#加載需要的包和資料
library(Seurat)
# devtools::install_github('satijalab/seurat-data')
library(SeuratData)
library(ggplot2)
library(patchwork)
library(dplyr)

#以之前pbmc的seurat标準流程為基礎,進行分析
DimPlot(pbmc)
sce=pbmc
table( Idents(sce ))
table([email protected]$seurat_clusters)
table([email protected]$orig.ident)

#由于CNV分析要用到infercnv包,其CreateInfercnvObject函數需要三個檔案建立對象:The raw_counts_matrix;the gene_order_file, contains chromosome, start, and stop position for each gene;The annotations_file, containing the cell name and the cell type classification

#擷取counts矩陣
dat=GetAssayData(sce,slot='counts',assay='RNA')
dat[1:4,1:4]

#擷取細胞亞群資訊
groupinfo=data.frame(v1=colnames(dat),v2= Idents(sce ) )
head(groupinfo)

#這裡使用了AnnoProbe包  https://github.com/jmzeng1314/AnnoProbe/
#AnnoProbe是生信技能樹健明老師開發的包,用于表達晶片資料分析,但也可以下載下傳GEO資料,進行進行基因注釋等功能,可以注釋基因并标記其在染色體上的位置
library(AnnoProbe)

geneInfor=annoGene(rownames(dat), "SYMBOL",'human')
colnames(geneInfor)
head(geneInfor)

#安裝染色體和基因位置排序,并将SYMBOL,chr,start,end這幾列留下
geneInfor=geneInfor[with(geneInfor,order(chr, start)),c(1,4:6)]

#去重(這裡也可以操作去除性染色體,也可以把染色體排序方式改變)
geneInfor=geneInfor[!duplicated(geneInfor[,1]),]
length(unique(geneInfor[,1]))
head(geneInfor)

#整理資料
dat=dat[rownames(dat) %in% geneInfor[,1],]
dat=dat[match( geneInfor[,1], rownames(dat) ),]
dim(dat)
head(groupinfo)
dat[1:4,1:4]
table(groupinfo$v2)
head(groupinfo)

# 為了節約計算機資源,直接抽樣
kp=sample(1:nrow(groupinfo),500)
groupinfo=groupinfo[kp,]
dat=dat[,kp]
# 如果是真實項目,且計算資源足夠,忽略這個抽樣的操作

#儲存檔案
expFile='expFile.txt'

write.table(dat,file =expFile,sep = '\t',quote = F)

groupFiles='groupFiles.txt'

write.table(groupinfo,file = groupFiles,sep = '\t',quote = F,col.names = F,row.names = F)
head(geneInfor)

geneFile='geneFile.txt'

write.table(geneInfor,file = geneFile,sep = '\t',quote = F,col.names = F,row.names = F)
複制
2.2 建立CNV對象
options(stringsAsFactors = F)
expFile='expFile.txt'
groupFiles='groupFiles.txt'
geneFile='geneFile.txt'

infercnv_obj = CreateInfercnvObject(raw_counts_matrix=expFile, annotations_file=groupFiles,delim="\t",gene_order_file= geneFile,ref_group_names=c("NK",'DC','Platelet'))
#這裡出現了報錯,經檢視,是expFile和groupFiles儲存為txt時,列名出現了不一緻,一個儲存成了TCGAGCCTTGTGAC-1,一個儲存成了TCGAGCCTTGTGAC.1,即expFile所有的-都變成了.,經過查找,并不清楚write.table函數那個參數導緻的

#是以,幹脆将groupFiles中的-先變成.,再儲存
library(do)

head(groupinfo$v1)

head(Replace(data=groupinfo$v1,from='-1',to='.1'))

groupinfo$v1<-Replace(data=groupinfo$v1,from='-1',to='.1')

head(groupinfo)

groupFiles1='groupFiles1.txt'
write.table(groupinfo,file = groupFiles1,sep = '\t',quote = F,col.names = F,row.names = F)
head(geneInfor)

infercnv_obj = CreateInfercnvObject(raw_counts_matrix=expFile, annotations_file=groupFiles,delim="\t",gene_order_file= geneFile,ref_group_names=c("NK",'DC','Platelet'))

#ref_group_names認為這些亞群的細胞是正常細胞
複制
2.3 運作CNV分析
## 這個取決于自己的分組資訊裡面的
# cutoff=1 works well for Smart-seq2, and
# cutoff=0.1 works well for 10x Genomics
# dir is auto-created for storing outputs
#cluster_by_groups: If observations are defined according to groups (ie. patients), each group of cells will be clustered separately. (default=FALSE, instead will use k_obs_groups setting)
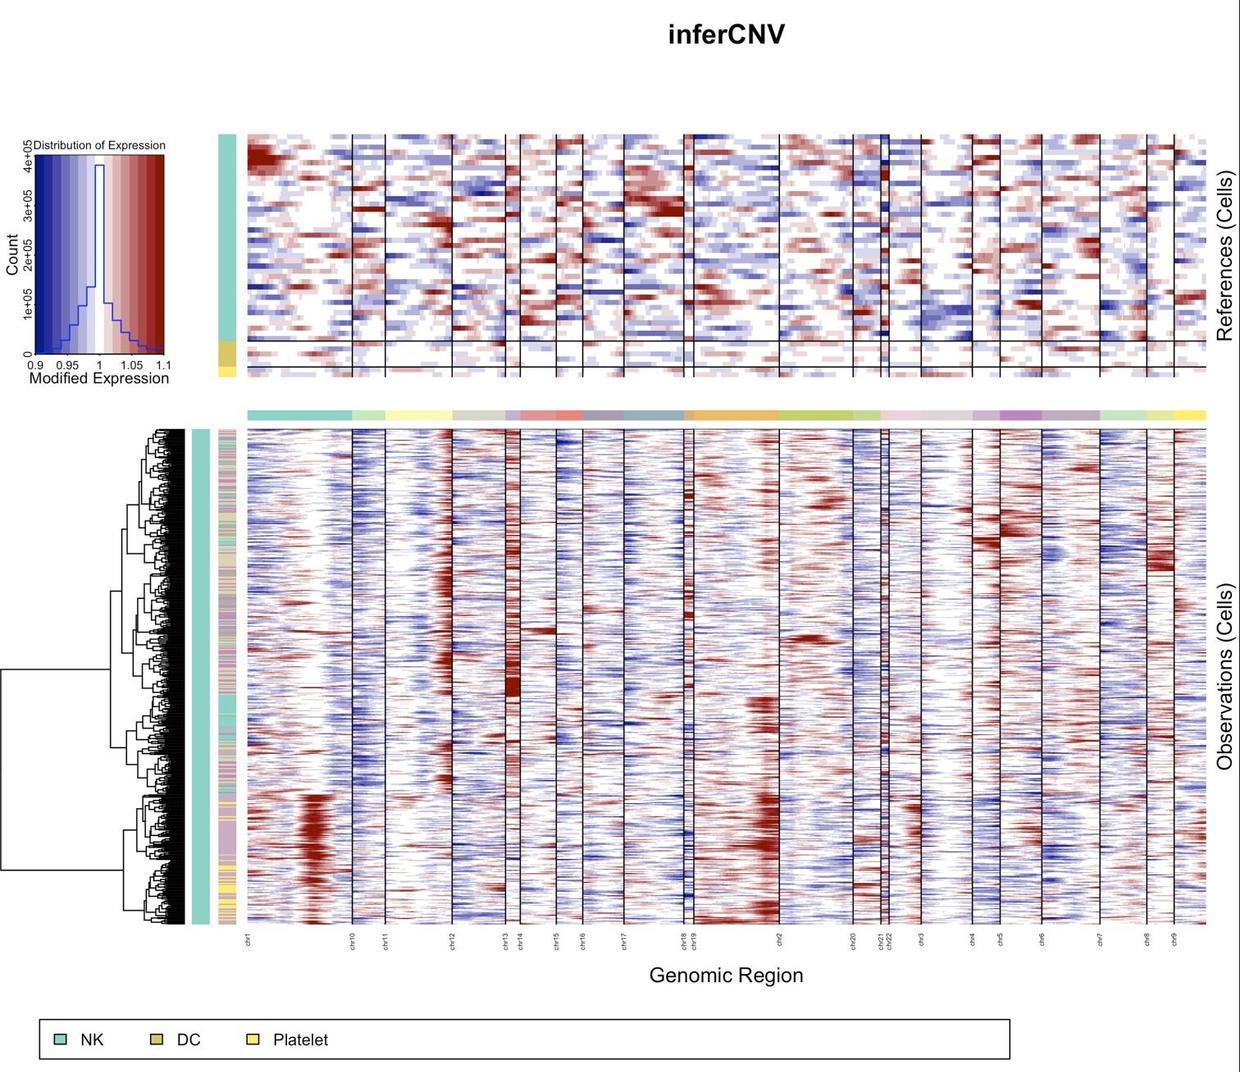
infercnv_obj2 = infercnv::run(infercnv_obj,cutoff=0.1, out_dir= "infercnv_output", cluster_by_groups=F, hclust_method="ward.D2", plot_steps=F) 複制
運作結束後,會在infercnv_output檔案夾下生成一系列檔案,如下圖
2.4 了解CNV分析結果——可視化
#加載需要的包
options(stringsAsFactors = F)
library(phylogram)
library(gridExtra)
library(grid)
require(dendextend)
require(ggthemes)
library(tidyverse)
library(Seurat)
library(infercnv)
library(miscTools)

#  導入 inferCNV dendrogram
#infercnv.observations_dendrogram.txt是除去之前設定的參考組(正常組)外的其他組的資料
infercnv.dend <- read.dendrogram(file = "infercnv_output/infercnv.observations_dendrogram.txt")

# Cut tree,k可設定成任意數,可以了解為細胞亞群
infercnv.labels <- cutree(infercnv.dend, k = 6, order_clusters_as_data = FALSE)

table(infercnv.labels)

# 給組别加顔色
the_bars <- as.data.frame(tableau_color_pal("Tableau 20")(20)[infercnv.labels])
colnames(the_bars) <- "inferCNV_tree"
the_bars$inferCNV_tree <- as.character(the_bars$inferCNV_tree)

infercnv.dend %>% set("labels",rep("", nobs(infercnv.dend)) )  %>% plot(main="inferCNV dendrogram") %>%
  colored_bars(colors = as.data.frame(the_bars), dend = infercnv.dend, sort_by_labels_order = FALSE, add = T, y_scale=10, y_shift = 0)
複制

2.5檢視拷貝數變異分組和細胞亞群間的關系
infercnv.labels=as.data.frame(infercnv.labels)
groupFiles='groupFiles.txt'
meta=read.table(groupFiles,sep = '\t')
infercnv.labels$V1=rownames(infercnv.labels)
meta=merge(meta,infercnv.labels,by='V1')
table(meta[,2:3])
             infercnv.labels
V2              1  2  3  4  5  6
  B             0  0  6 36  5 18
  CD14+ Mono   31 54  3  3  0  2
  CD8 T         0  0  7  2 26 23
  FCGR3A+ Mono 27  5  0  0  0  1
  Memory CD4 T  0  0 12  2 41 27
  Naive CD4 T   1  1 18  2 41 59

#可以檢視拷貝數變異分組和細胞亞群間的關系
複制
檢視每個細胞有無拷貝數變異
#代碼來自生信技能樹曾老師
if( ! file.exists(  "cnv_scores.csv")){
  tmp=read.table("infercnv_output/infercnv.references.txt", header=T)
  down=mean(rowMeans(tmp)) - 2 * mean( apply(tmp, 1, sd))
  up=mean(rowMeans(tmp)) + 2 * mean( apply(tmp, 1, sd))
  oneCopy=up-down
  oneCopy
  a1= down- 2*oneCopy
  a2= down- 1*oneCopy
  down;up
  a3= up +  1*oneCopy
  a4= up + 2*oneCopy

  cnv_table <- read.table("infercnv_output/infercnv.observations.txt", header=T)
  # Score cells based on their CNV scores
  # Replicate the table
  cnv_score_table <- as.matrix(cnv_table)

  cnv_score_mat <- as.matrix(cnv_table)
  # Scoring
  cnv_score_table[cnv_score_mat > 0 & cnv_score_mat < a2] <- "A" #complete loss. 2pts
  cnv_score_table[cnv_score_mat >= a2 & cnv_score_mat < down] <- "B" #loss of one copy. 1pts
  cnv_score_table[cnv_score_mat >= down & cnv_score_mat <  up ] <- "C" #Neutral. 0pts
  cnv_score_table[cnv_score_mat >= up  & cnv_score_mat <= a3] <- "D" #addition of one copy. 1pts
  cnv_score_table[cnv_score_mat > a3  & cnv_score_mat <= a4 ] <- "E" #addition of two copies. 2pts
  cnv_score_table[cnv_score_mat > a4] <- "F" #addition of more than two copies. 2pts

  # Check
  table(cnv_score_table[,1])

 # B    C    D
 # 49 1908  253

  # 将ABCD用數字代替,以得到各細胞拷貝數變異矩陣
  cnv_score_table_pts <- cnv_table
  rm(cnv_score_mat)
  #
  cnv_score_table_pts[cnv_score_table == "A"] <- 2
  cnv_score_table_pts[cnv_score_table == "B"] <- 1
  cnv_score_table_pts[cnv_score_table == "C"] <- 0
  cnv_score_table_pts[cnv_score_table == "D"] <- 1
  cnv_score_table_pts[cnv_score_table == "E"] <- 2
  cnv_score_table_pts[cnv_score_table == "F"] <- 2

  # Scores are stored in “cnv_score_table_pts”. Use colSums to add up scores for each cell and store as vector
  cell_scores_CNV <- as.data.frame(colSums(cnv_score_table_pts))
  colnames(cell_scores_CNV) <- "cnv_score"
  head(cell_scores_CNV)
  write.csv(x = cell_scores_CNV, file = "cnv_scores.csv")

}
複制
檢視各亞群間拷貝數變異情況
# 除去了reference後的走inferCNV的細胞
cell_scores_CNV=read.csv('cnv_scores.csv',row.names = 1)
head(cell_scores_CNV)


load(file = '../section-01-cluster/basic.sce.pbmc.Rdata')
sce=pbmc
[email protected]
phe$celltype=Idents(sce)
head(rownames(phe))
head(rownames(cell_scores_CNV))

#rownames(phe)=paste0('X',rownames(phe))
rownames(phe)=gsub('-','.',rownames(phe))

head(rownames(phe))
head(rownames(cell_scores_CNV))

head(rownames(phe))
phe=phe[rownames(phe) %in% rownames(cell_scores_CNV),]
identical(rownames(phe),rownames(cell_scores_CNV))

infercnv.labels <- cutree(infercnv.dend, k = 6, order_clusters_as_data = FALSE)
phe$inferCNV= infercnv.labels[match(rownames(phe), names(infercnv.labels) )]

phe$cnv_scores  =  cell_scores_CNV[rownames(phe),]

table(phe$celltype,phe$inferCNV)
head(rownames(phe))
dim(phe)
library(ggpubr)
p1=ggboxplot(phe,'celltype','cnv_scores', fill = "celltype")
p1= p1+ theme(axis.text.x = element_text(angle = 45,
                                    vjust = 0.5, hjust=0.5))
p2=ggboxplot(phe,'inferCNV','cnv_scores', fill = "inferCNV")
library(patchwork)
p1+p2
ggsave(filename = 'anno_CNVscore.pdf')
table(phe$celltype,phe$inferCNV)

#将拷貝數變異資訊注釋到sce中
#rownames(phe)=gsub('X','',rownames(phe))
rownames(phe)=gsub('[.]','-',rownames(phe))
head(rownames(phe))

sce
tail(rownames([email protected]))
head(rownames(phe))
sce$celltype=Idents(sce)
table(sce$celltype)
sce=subset(sce,celltype %in% c('epithelial' ))
sce
kp=rownames([email protected]) %in% rownames(phe)
table(kp)
sce=sce[,kp]

phe=phe[rownames([email protected]),]

[email protected]=phe
head(phe)
save(sce, file = 'epi_sce_annoCNV.Rdata')
複制
參考來源
#section 3已更新#「生信技能樹」單細胞公開課2021_哔哩哔哩_bilibili
緻謝
I thank Dr.Jianming Zeng(University of Macau), and all the members of his bioinformatics team, biotrainee, for generously sharing their experience and codes.
THE END