R海拾遺-shiny4
概述
shiny基礎終章,shiny反應表達式學習
代碼
在工作目錄中建立一個名為stockVis的新檔案夾
下載下傳以下檔案放在stockVis中
app.R:https://shiny.rstudio.com/tutorial/written-tutorial/lesson6/stockVis/app.R
helper.R:https://shiny.rstudio.com/tutorial/written-tutorial/lesson6/stockVis/helpers.R
使用runApp啟動應用程式runApp("stockVis")
setwd("D:\\360MoveData\\Users\\cmusunqi\\Documents\\GitHub\\R_and_python\\R")
library(shiny)
runApp("stockVis")
複制
結果
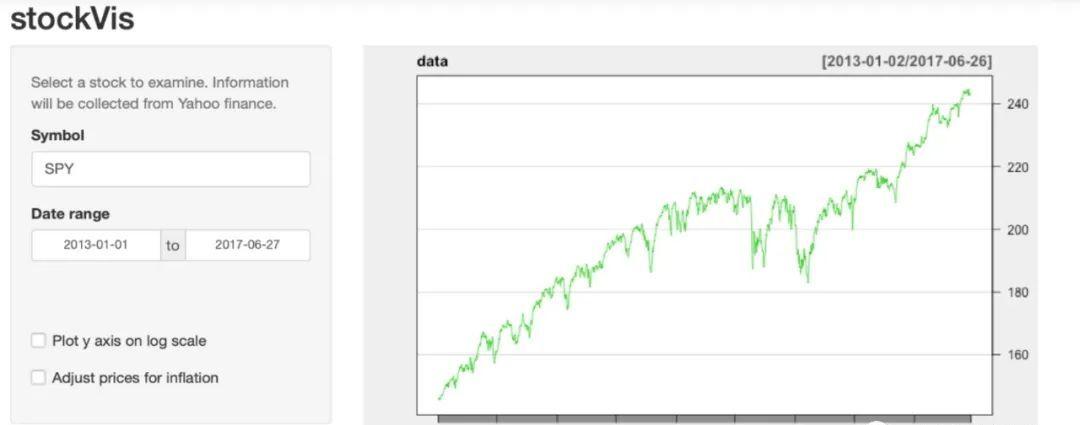
這個stockvis展示的内容
- 選擇一隻股票
- 選擇日期展示
- 選擇是否将x軸log轉換
- 是否通過通貨膨脹對股票價格進行調整
預設情況下,stockVis會顯示SPY代碼(整個标普500的指數)。要查找不同的股票,請鍵入雅虎财經能夠識别的股票符号。如GOOG(谷歌)、AAPL (Apple)和GS (Goldman Sachs)
注意到的一點是目前預設的app展示時的adjust prices for infaltion 目前是不可選的狀态
stockVis依賴quantmod包中的兩個功能:
- getSymbols: 直接從雅虎财經和聖路易斯聯邦儲備銀行等網站下載下傳金融資料。
- chartSeries 圖表中顯示價格
同時需要使用helps.r腳本,腳本包含一個根據通貨膨脹調整股票價格的函數。
解析app.r包
# 導入包
library(shiny)
# 導入需要計算的函數
library(quantmod)

# 導入計算通貨膨脹的函數 ----
source("helpers.R")

#ui函數編寫
ui <- fluidPage(
    # 标題
  titlePanel("stockVis"),
  # 工具條設計
  sidebarLayout(

    sidebarPanel(
        # 幫助文本
      helpText("Select a stock to examine.
        Information will be collected from Yahoo finance."),
        # 輸入文本
      textInput("symb", "Symbol", "SPY"),
        # 日期選擇框
      dateRangeInput("dates",
                     "Date range",# 框名
                     start = "2013-01-01",
                     end = as.character(Sys.Date())),
      br(),
      br(),
    #   複選框
      checkboxInput("log", "Plot y axis on log scale",
                    value = FALSE),
    # 複選框
      checkboxInput("adjust",
                    "Adjust prices for inflation", value = FALSE)
    ),
    # 主要繪圖區域
    mainPanel(plotOutput("plot"))
  )
)

# 服務代碼
server <- function(input, output) {
    # 反應表達式
  dataInput <- reactive({
    getSymbols(input$symb, src = "yahoo",
               from = input$dates[1],
               to = input$dates[2],
               auto.assign = FALSE)
  })

  output$plot <- renderPlot({
    chartSeries(dataInput(), theme = chartTheme("white"),
                type = "line", log.scale = input$log, TA = NULL)
  })

}

# 運作
shinyApp(ui, server)
複制
目前的程式有個問題,當你選擇第一個框的時候,shiny會重新從雅虎獲得資料,相當于運作了下面的程式,并重新繪制圖檔,這可能會導緻運算變慢,同時雅虎會認為資料異常,進而封閉通路
output$plot <- renderPlot({
  data <- getSymbols(input$symb, src = "yahoo",
                     from = input$dates[1],
                     to = input$dates[2],
                     auto.assign = FALSE)

  chartSeries(data, theme = chartTheme("white"),
              type = "line", log.scale = input$log, TA = NULL)
})
複制
是以需要使用到反應表達式
dataInput <- reactive({
  getSymbols(input$symb, src = "yahoo",
    from = input$dates[1],
    to = input$dates[2],
    auto.assign = FALSE)
})
複制
反應表達式可以緩存值,并知道值何時已經過時。
第一次運作反應表達式時,該表達式将其結果儲存在計算機的記憶體中。下一次調用響應表達式時,它可以傳回這個儲存的結果,而不進行任何計算,這會使應用程式更快
添加代碼使得第二個複選框工作
server <- function(input, output) {

  dataInput <- reactive({
      getSymbols(input$symb, src = "yahoo",
          from = input$dates[1],
          to = input$dates[2],
          auto.assign = FALSE)
  })

  finalInput <- reactive({
    if (!input$adjust) return(dataInput())
    adjust(dataInput())
  })

  output$plot <- renderPlot({
    chartSeries(finalInput(), theme = chartTheme("white"),
        type = "line", log.scale = input$log, TA = NULL)
  })
}
複制
結束語
反應表達式
reactive({})
,提高計算效能,到這裡基本上關于shiny的基礎教程已經更新完畢,後續看看有沒有大的項目玩一玩,可惜最近伺服器不給力,深度學習的東西沒法開展,就說這麼多吧,love&peace
甜言蜜語最危險的
很多人看不開,也不體面
因小失大