[toc]
Prometheus 系統監控
Prometheus 是一套開源的系統監控告警架構,作為 CNCF 中重要的一員,活躍度僅次于 kubernetes,廣泛用于 kubernetes 叢集的監控系統中。
prometheus 架構如下:
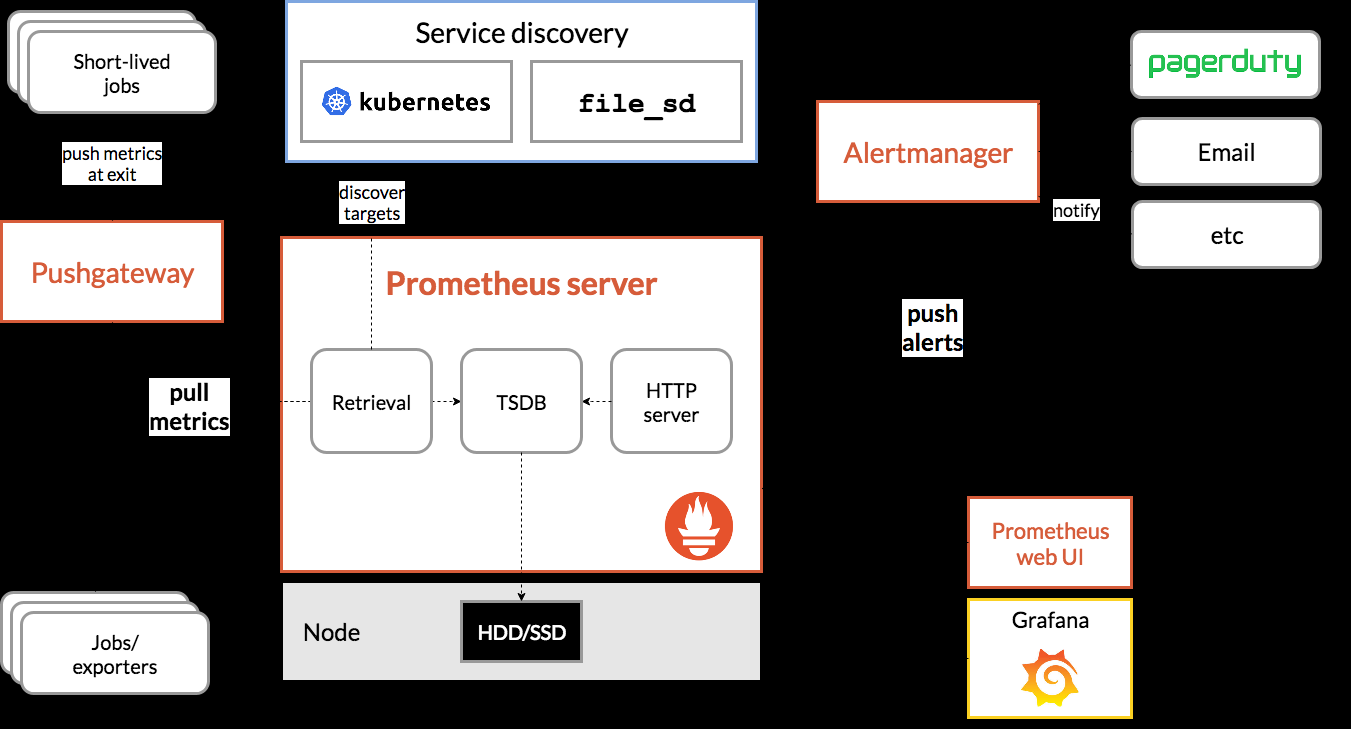
prometheus-architecture
Prometheus server 會定期從配置的 target 或者 pushGateway (收集短生存期的jobs) 通過 http 主動拉取 metrics 存儲到本地,并根據定義的規則儲存到時間序列中,并向 alertmaanger 推送告警。
PromQL 是内置的查詢工具,通過 API 或者其他可視化工具,如 Grafana, 查詢存儲在時序資料庫中的樣本,進行分析展示。
采集對象可以通過服務發現或者直接靜态配置 job 指定。有些 jobs 存活的時間很多,無法等 prometheus 定期去拉取資料,通過将資料主動推給 pushGateway 儲存,prometheus 在到 pushGateway 拉取。’
Prometheus 按照設定的規則向 Alertmanager 發送告警, Alertmanager 負責告警去重,分組,并送至正确的接受者(email,posGenie 等) 或者屏蔽。
資料模型
Prometheus 以 metric(名額)的形式儲存所有采集的監控資料到内置的時序資料庫中,同一 metric、label 的資料和時間戳形成時序資料流 :
<metric name>{<label name>=<label value>, ...}
。
metricname 和 label 符合 :[a-zA-Z:]a-zA-Z0-9_:*
收集名額 metric 的類型一般分為:
-
counter: 累加,比如總請求數,錯誤數等,随時間持續增加的樣本;# 包含 mertic:
metric_name_bucket{le="上邊界"} # 小于等于的樣本數
metric_name_bucket{le="+Inf"} # 樣本總數
metric_name_sum,_count # 所有樣本值的總和,樣本總數
- gauge: 測量值,反映實時的一個狀态,如溫濕度值,cpu使用率,其數值可上下波動;
- histogram: 直方圖,如請求時間統計,對資料進行分區間統計,預設分布區間 buckets 為 {0.005,0.01,0.025,0.05,0.075,0.1,0.25,0.5,0.75,1,2.5,5,7.5,10},可以自定定義覆寫。每一個區間就像一個個 bucket(桶),histogram 将收到的樣本計入配置的桶内,供後續分析。
- summary: 摘要,類似 histogram,表示一段時間資料采樣結果,請求持續時間,響應時間等;不同于 histogram,summary 直接存儲了 quantile(分位數)值,而不是通過區間再取得計算結果。metric_name{quantile="quantile-val"} # 指定 quantile 的樣本數,50% 的相應時間是多少,90%的相應時間是多少objectives:mapfloat64float64{0.5: 0.05, 0.9: 0.01, 0.99: 0.001}metric_name_sum,_count # 同 histogram
參考 prometheus.io-metric_types
jobs
在 prometheus 中,會依據配置或者服務發現去拉取 metric,拉取的一個端點稱為一個 instance(配置中一個 ip:port),一般對應一個程序;多個執行個體,提供相同的服務,這樣一個叢集被稱為 jobs;如:
- job: api-server
- instance1: 1.2.3.4:5670
- instance 2: 1.2.3.4:5671
- instance 3: 5.6.7.8:5670
- instance 4: 5.6.7.8:5671
prometheus 會給每個樣本自動加上 job 和 instance 的标簽。
安裝
項目首頁 安裝手冊
通過 docker 可以很快速地啟動 prometheus;
$ docker run --name prometheus -d -p 9090:9090 prom/prometheus
# docker-compose 指定配置檔案參數
#command: --config.file=/prometheus_conf/prometheus.yml
複制
通過 web 通路 http://127.0.0.1:9090/targets,可以看到 prometheus 監控自己的狀态為 up;
Prometheus 配置參考
Grafana 可視化
Grafana 是一個跨平台的開源度量分析和可視化工具。
通過 docker 部署 grafana
$ docker run -d --name=grafana -p 3000:3000 grafana/grafana 複制
登入 localhost:3000 預設的賬号以及密碼為 admin admin;
登入成功後,首先需要配置 Data Sources,type 選擇 Prometheus,http 則是填寫 prometheus 的接口位址(預設是 http://localhost:9090)。

grafana-datasource
詳細 參考
準備後資料源後,建立 dashboard,設定 metric 進行繪圖。
image.png
應用監控接入
搭建完監控系統後,需要配置監控對象,使其暴露 metrics 給 Prometheus,定時通過 http 通路拉取資料。兩種方式,一種直接通過 exporter 調用監控對象現有接口讀取資料,再以 /metric 暴露出來,另一種是集合 prometheus 用戶端庫,實作 http svr。
exporter 接入
現在很多雲原生應用都實作了 prometheus 的監控接口,如 etcd,k8s 等,可以直接被 prometheus 監控,對于沒有提供的應用,如 redis,mysql,可以通過一個代理實作,叫做 exporter,exporter 通過調用被監控應用本身提供的接口擷取資料,再将資料以 prometheus 的規範對外提供,如 node exporter(監控機器 cpu 記憶體等),mysql exporter, redis exporter 等。
如下,示例安裝 redis exporter(redis 本地預設安裝)
$ docker run --name redis_exporter -d --rm -p 9121:9121 oliver006/redis_exporter:latest
# docker-composer 指定參數
#  command: -redis.addr redis://redis:6379

# 擷取 redis 監控資料
$ curl localhost:9121/metrics                               # HELP go_gc_duration_seconds A summary of the GC invocation durations.
# TYPE go_gc_duration_seconds summary
go_gc_duration_seconds{quantile="0"} 0
go_gc_duration_seconds{quantile="0.25"} 0
go_gc_duration_seconds{quantile="0.5"} 0
go_gc_duration_seconds{quantile="0.75"} 0
go_gc_duration_seconds{quantile="1"} 0
go_gc_duration_seconds_sum 0
go_gc_duration_seconds_count 0
# HELP go_goroutines Number of goroutines that currently exist.
# TYPE go_goroutines gauge
go_goroutines 6
....
複制
修改 prometheus 配置,使其定時到 exporter 拉取資料:
docker 中配置檔案:/etc/prometheus/prometheus.yml
scrape_configs:
- job_name: 'redis'
    static_configs:
    - targets: ['172.17.0.1:9121']
複制
重新開機 prometheus,便可以在其 web 看到 redis 統計的資料了。
應用中內建 prometheus client
對于自己開發的應用,可以在應用中集合 prometheus 用戶端,實作 /metric http 供 prometheus 讀取監控資料實作上報。
對于 golang ,最簡單的 example :
package main
import (
"log"
"net/http"
github.com/prometheus/client_golang/prometheus/promhttp
)
func main() {

    // expose prometheus metrics接口
    http.Handle("/metrics", promhttp.Handler())
    log.Fatal(http.ListenAndServe(":8080", nil))
}

// xxVec 定義了一系列具有相同描述的 metric,通過指定label區分
// prometheus.NewCounter
// prometheus.NewCounterVec
複制
詳細參考:
- golang-doc
- golang-metric
告警 Alertmanager
Alertmanager 接收 prometheus 警報後,會進行去重,分組,路由到對應的接收端進行個告警,如郵件,webhook,slack。。。
-
grouping 分組
将性質類似的告警組成一類,如執行個體連接配接資料庫失敗,幾百個一起上報,prometheus 會對應每個執行個體推送一警報報到 alertmanager,這是如果想看到那個服務那些執行個體受到影響,alermanager 會依據叢集和警報名分組标簽,推送一個告警。
-
inhibition 抑制
一個告警已經觸發,可以配置關心這個叢集的其他警報無效,避免其他是以問題觸發的問題發送大量警報通知。
-
sliences 靜默
設定時間忽略警報,不發告警。
啟動 alertmanager
docker 啟動
docker run -d -p 9093:9093 -v /configuration/alertmanager/:/etc/alertmanager/config.yml --name alertmanager prom/alertmanager 複制
docker-compose
alertmanager:
    image: prom/alertmanager:latest
    command: --config.file=/alertmanager_conf/config.yml
    restart: always
    ports:
     - ${alertmanager_port}:9093
    volumes:
     - /configuration/alertmanager:/alertmanager_conf/配置 prometheus 警告prometheus 配置檔案中配置讀取規則檔案,如下例子,用于判斷執行個體下線時發出告警;
複制
# Load rules once and periodically evaluate them according to the global 'evaluation_interval'.
rule_files:
- "node_down.yml"node_down.yml 内容:groups:
- name: node\_down # 分組名
rules:
- alert: InstanceDown # 警告名稱
expr: up == 0 # 條件
for: 1m # 持續時間出發告警
labels:
severity: lora #自定義标簽
annotations: # 發送給 alert 的内容
summary: "Instance {{ $labels.instance }} down"
description: "{{ $labels.instance }} of job {{ $labels.job }} has been down for more than 1 minutes.重新開機 prometheus,手動停止一個執行個體測試下:執行個體停止,觸發條件,等待持續時間,狀态設定為 `PENDING`
配置的等待時間過後執行個體依然處于down,發出警告,狀态改為 `Firing`配置 alertmanager 告警規則配置完 prometheus 警告規則後,需要将 alertmanager 寫入 prometheus 配置檔案中,發送警告時可以發送給 alertmanagerprometheus 配置檔案中配置 alertmanager 執行個體資訊# Alertmanager configuration
alerting:
alertmanagers:
- static\_configs:
- targets:
- "alertmanager:9093"之後便可以在 alertmanager 中看到收到的警告:
配置 alertmanager 告警規則,收到 prometheus 消息後的如何反應;
global:
resolve\_timeout: 5m
smtp\_smarthost: 'smtp.163.com:465'
smtp\_from: '[email protected]'
smtp\_auth\_username: '[email protected]'
smtp\_auth\_password: 'BACL'
smtp\_require\_tls: false #注意這個一定要寫false,預設是true,若不改成false會有require\_tls' is true (default) but \"smtp.qq.com:465\" does not advertise the STARTTLS extension
http\_config:
proxy\_url: "kk"
templates:
- '\*.tmpl'
# 所有報警資訊進入後的根路由,用來設定報警的分發政策
route:
group\_by: 'lora' # 這裡的标簽清單是接收到報警資訊後的重新分組标簽
group\_wait: 10s # 第一次等待多久時間發送一組警報的通知
group\_interval: 10s # 在發送新警報前的等待時間
repeat\_interval: 1m # 如果一個報警資訊已經發送成功了,等待'repeat\_interval'時間來重新發送他們
receiver: 'GOOGLE-email' # 發送警報的接收者的名稱,與receivers name的名稱相同
receivers:
- name: 'GOOGLE-email'
email\_configs: # 郵箱配置
- send\_resolved: true # 告警解決是否通知,預設是不通知
to: '[email protected]'
html: '{{ template "email.html" . }}'
headers: { Subject: "WARN lora 報警郵件"} # 接收郵件的标題
inhibit\_rules:
- source\_match:
severity: 'critical'
- target\_match:
severity: 'warning'
equal: 'alertname', 'dev', 'instance'
複制
https://zhuanlan.zhihu.com/p/44467197
參考
- prometheus入門
- grafana+prometheus
- prometheus exporter redis
- prometheus golang
- prometheus 非官方手冊
- 郵件告警