`prometheus-net.DotNetRuntime` 擷取 CLR 運作名額原了解析
prometheus-net.DotNetRuntime
prometheus-net.DotNetRuntime
Intro
前面內建 Prometheus 的文章中簡單提到過,
prometheus-net.DotNetRuntime
可以擷取到一些 CLR 的資料,比如說 GC, ThreadPool, Contention, JIT 等名額,而這些名額可以很大程度上幫助我們解決很多問題,比如應用執行過程中是否經常發生 GC,GC 等待時間時間是否過長,是否有發生死鎖或競争鎖時間過長,是否有發生線程池餓死等等一系列問題,有了這些名額我們就可以清晰的在運作時了解到這些資訊。
來看一下官方介紹
A plugin for the prometheus-net package, exposing .NET core runtime metrics including:These metrics are essential for understanding the peformance of any non-trivial application. Even if your application is well instrumented, you're only getting half the story- what the runtime is doing completes the picture.
- Garbage collection collection frequencies and timings by generation/ type, pause timings and GC CPU consumption ratio
- Heap size by generation
- Bytes allocated by small/ large object heap
- JIT compilations and JIT CPU consumption ratio
- Thread pool size, scheduling delays and reasons for growing/ shrinking
- Lock contention
- Exceptions thrown, broken down by type
支援的名額
Contention Events
隻要運作時使用的 System.Threading.Monitor 鎖或 Native鎖出現争用情況,就會引發争用事件。
一個線程等待的鎖被另一線程占有時将發生争用。
| Name | Description | Type |
|---|---|---|
| dotnet_contention_seconds_total | 發生鎖争用的耗時(秒)總計 | Counter |
| dotnet_contention_total | 鎖争用獲得鎖的數量總計 |
Thread Pool Events
Worker thread 線程池和 IO thread 線程池資訊
| dotnet_threadpool_num_threads | 線程池中活躍的線程數量 | Gauge |
| dotnet_threadpool_io_num_threads | IO 線程池中活躍線程數量(WindowsOnly) | |
| dotnet_threadpool_adjustments_total | 線程池中線程調整總計 |
Garbage Collection Events
Captures information pertaining to garbage collection, to help in diagnostics and debugging.
| dotnet_gc_collection_seconds | 執行 GC 回收過程耗費的時間(秒) | Histogram |
| dotnet_gc_pause_seconds | GC 回收造成的 Pause 耗費的時間(秒) | |
| dotnet_gc_collection_reasons_total | 觸發 GC 垃圾回收的原因統計 | |
| dotnet_gc_cpu_ratio | 運作垃圾收集所花費的程序CPU時間的百分比 | |
| dotnet_gc_pause_ratio | 程序暫停進行垃圾收集所花費的時間百分比 | |
| dotnet_gc_heap_size_bytes | 目前各個 GC 堆的大小 (發生垃圾回收之後才會更新) | |
| dotnet_gc_allocated_bytes_total | 大小對象堆上已配置設定的位元組總數(每100 KB配置設定更新) | |
| dotnet_gc_pinned_objects | pinned 對象的數量 | |
| dotnet_gc_finalization_queue_length | 等待 finalize 的對象數 |
JIT Events
| dotnet_jit_method_total | JIT編譯器編譯的方法總數 | |
| dotnet_jit_method_seconds_total | JIT編譯器中花費的總時間(秒) | |
| dotnet_jit_cpu_ratio | JIT 花費的 CPU 時間 |
內建方式
上面的列出來的名額是我覺得比較重要的名額,還有一些 ThreadPool Scheduling 的名額和 CLR Exception 的名額我覺得意義不是特别大,有需要的可以去源碼裡看一看
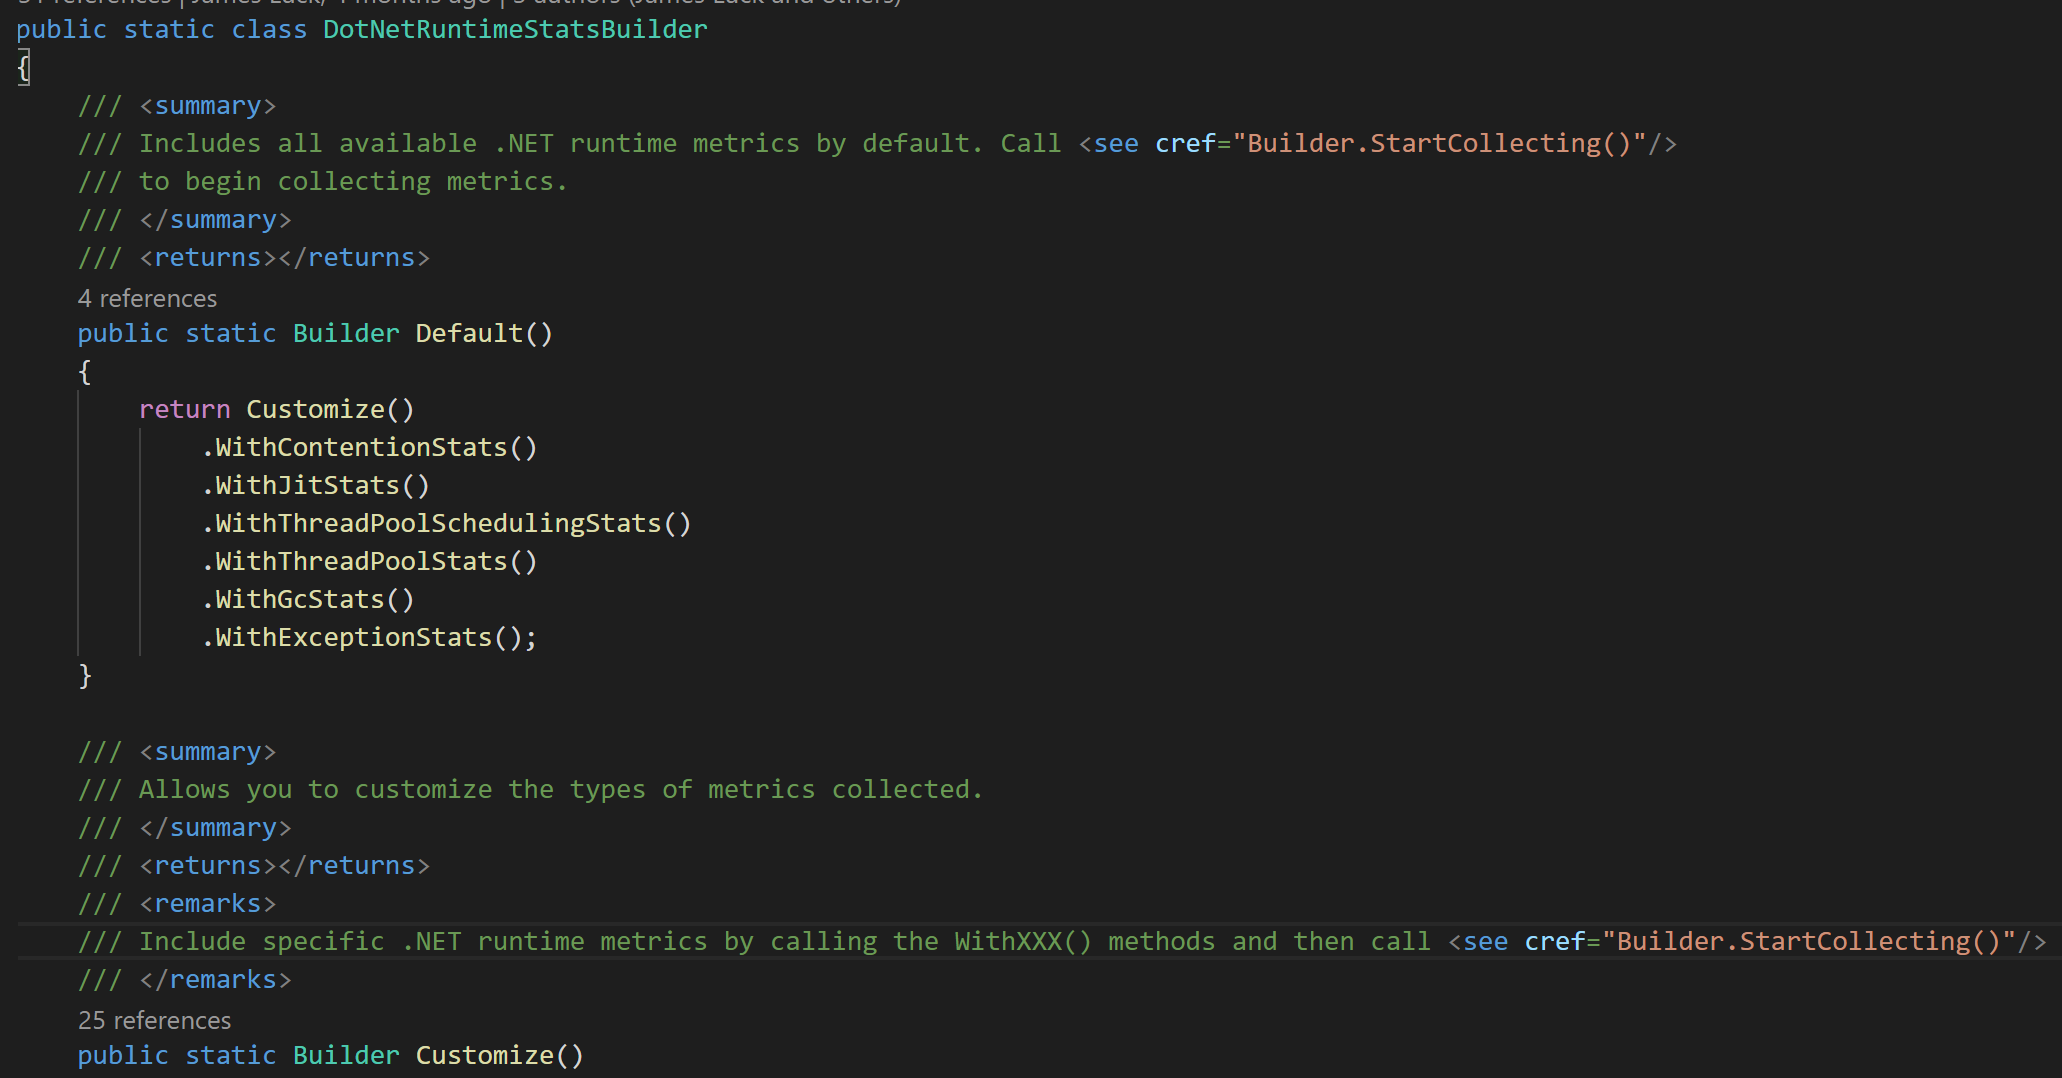
內建的方式有兩種,一種是作者提供了一個預設的 Collector 會去收集所有支援的 CLR 名額資訊,另外一種則是可以自己自定義的要收集的 CLR 名額類型,來看示例:
使用預設的 Collector 收集 CLR 名額
DotNetRuntimeStatsBuilder.Default().StartCollecting();
使用自定義的 Collector 收集 CLR 名額
DotNetRuntimeStatsBuilder.Customize()
    .WithContentionStats() // Contention event
    .WithGcStats() // GC 名額
    .WithThreadPoolStats() // ThreadPool 名額
    // .WithCustomCollector(null) // 你可以自己實作一個自定義的 Collector
    .StartCollecting();
上面提到過預設的 Collector 會收集支援的所有的 CLR 名額,且看源碼怎麼做的
建構了一個
Builder
通過建造者模式來建構複雜配置的收集器,類似于 .net core 裡的
HostBuilder
/
LoggingBuilder
...,像極了
Host.CreateDefaultBuilder
,做了一些變形
源碼位址:https://github.com/djluck/prometheus-net.DotNetRuntime/blob/master/src/prometheus-net.DotNetRuntime/DotNetRuntimeStatsBuilder.cs
實作原理
那它是如何工作的呢,如何實作捕獲 CLR 的名額的呢,下面我們就來解密一下,
在項目 README 裡已經有了簡單的介紹,是基于 CLR 的 ETW Events 來實作的,具體的 CLR 支援的 ETW Events 可以參考文檔:https://docs.microsoft.com/en-us/dotnet/framework/performance/clr-etw-events
而 ETW Events 是通過
EventSource
的方式使得我們可以在程序外擷取到程序的一些運作資訊,這也是我們可以通過 PerfMonitor/PerfView 等方式程序外擷取程序 CLR 資訊的重要實作方式,同樣的微軟的新的診斷工具 dotnet diagnostic tools 的實作方式
EventPipe
也是基于
EventSOurce
的
而
EventSource
的事件不僅僅可以通過程序外的這些工具來消費,我們也可以在應用程式中實作
EventListener
來實作程序内的
EventSource
事件消費,而這就是
prometheus-net.DotNetRuntime
這個庫的實作本質方法
可以參考源碼:https://github.com/djluck/prometheus-net.DotNetRuntime/blob/master/src/prometheus-net.DotNetRuntime/DotNetEventListener.cs
具體的事件處理是在對應的 Collector 中:
https://github.com/djluck/prometheus-net.DotNetRuntime/tree/master/src/prometheus-net.DotNetRuntime/StatsCollectors
Metrics Samples
為了比較直覺的看到這些名額可以帶來的效果,分享一下我的應用中用到的一些 dashboard 截圖
Lock Contention

GC
從上面的圖可以清晰的看到這個時間點發生了一次垃圾回收,此時 GC Heap 的大小和 GC 垃圾回收的CPU 占用率和耗時都可以大概看的出來,對于我們運作時診斷應用程式問題會很有幫助
Thread
Thread 的資訊還可以拿到一些 threadpool 線程排程的數量以及延遲,這裡沒有展示出來,
目前我主要關注的是線程池中線程的數量和線程池線程調整的原因,線程池線程調整的原因中有一個是
starvation
,這個名額尤其需要關注一下,應避免出現 threadpool starvation 的情況,出現這個的原因通常是因為有一些不當的用法,如:
Task.Wait
、
Task.Result
await Task.Run()
來把一個同步方法變成異步等不好的用法導緻的
DiagnosticSource
除了
EventSource
之外,還有一個
DiagnosticSource
可以幫助我們診斷應用程式的性能問題,目前微軟也是推薦類庫中使用
DiagnosticSource
的方式來讓應用診斷類庫中的一些性能問題,這也是目前大多數 APM 實作的機制,Skywalking、ElasticAPM、OpenTelemetry 等都使用了
DiagnosticSource
的方式來實作應用程式的性能診斷
如果是程序外應用程式的性能診斷推薦首選
EventSource
,如果是程序内推薦首選
DiagnosticSource
通常我們都應該使用
DiagnosticSource
,即使想程序外捕獲,也是可以做到的
關于這二者的使用,可以看一下這個 Comment https://github.com/dotnet/aspnetcore/issues/2312#issuecomment-359514074
More
除了上面列出來的那些名額還有一些名額,比如 exception,threadpool scheduling,還有目前 dotnet 的環境(系統版本,GC 類型,Runtime 版本,程式 TargetFramework,CPU 數量等),有興趣的可以用一下試一下
exception 名額使用下來感覺幫助不大,有一些即使是已經處理的或者忽略的 Exception 也會被統計,這些 Exception 大多并不會影響應用程式的運作,如果參考這個的話可能會帶來很多的困擾,是以我覺得還是需要應用程式來統計 exception 名額更為合适一些
prometheus-net.DotNetRuntime
作為
prometheus-net
的一個插件,依賴于
prometheus-net
去寫 metrics 資訊,也就是說 metrics 的資訊可以通過
prometheus-net
來擷取
內建 asp.net core 的時候和之前內建
prometheus-net
是一樣的,metrics path 是同一個,可以參考我這個項目: https://github.com/OpenReservation/ReservationServer/tree/dev/OpenReservation
注意:作者推薦 .netcore3.0 以上使用,.netcore 2.x 會有一些 BUG,可以在 Issue 裡看到
Reference
- https://github.com/djluck/prometheus-net.DotNetRuntime
- https://docs.microsoft.com/en-us/dotnet/framework/performance/clr-etw-events
- https://github.com/dotnet/aspnetcore/issues/2312#issuecomment-359514074
- https://github.com/OpenReservation/ReservationServer
本文版權歸作者和部落格園共有,歡迎轉載,但未經作者同意必須保留此段聲明,且在文章頁面明顯位置給出原文連接配接,否則保留追究法律責任的權利。