介紹了PopupTemplate中content變化的内容的格式如何用一個方法體去控制。
先看結果截圖吧(不看過程可以直接看總結,在文末):
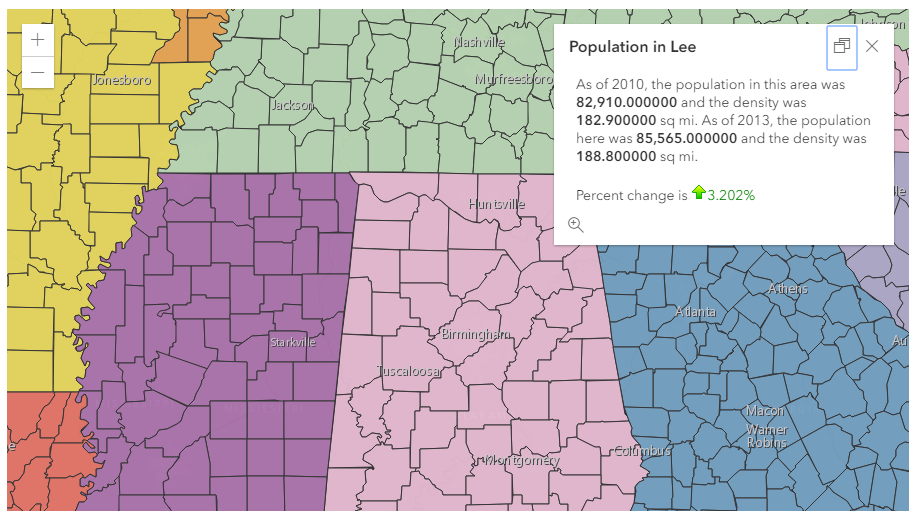

随便點選了兩個城市斑塊,出現結果如圖。
我來解讀一下這結果和以前的有什麼不同:
這個例子使用了PopupTemplate,資料是Layer(使用PortalID建立的Layer)。
但是我們看到圖中有個地方不同:當Percent change is這個東西是負數的時候,就是紅色+紅色下箭頭,反之則是綠色字+綠色上箭頭。
實際上,這兩個箭頭是兩個png圖檔。
見html同目錄下的兩個檔案:
是以說,這種特定格式,能随着數字正負自動判斷使用什麼圖檔、什麼樣式的content是怎麼實作的呢?
解讀開始。
一、給出引用(用到的子產品)
require(
    [
        "esri/Map", "esri/views/MapView", "esri/layers/Layer",
        "dojo/dom", "dojo/number", "dojo/on", "dojo/domReady!"
    ],
    function(){...}
);
二、函數參數(第二參數/回調函數)
function(Map, MapView, Layer, dom, number, on){
    var map = new Map({...});
    var view = MapView({...});
    Layer.fromPortalItem({...})
    .then(function(layer)
        {
            map.add(layer);
            var popupTemplate = {...};
            layer.popupTemplate = popupTemplate;
            populationChange = function(...){...};
        });
}
省略了部分代碼。在Layer.fromPortalItem傳回的Promise對象中,使用了then()方法回調一個函數,操作此Promise傳回的layer對象。
首先使用map的add()方法添加layer到地圖中去。
然後是定義一個popupTemplate,并賦給layer的popupTemplate屬性。
到這裡,都很正常,問題是,
到現在為止都沒說那個自定義的content是怎麼弄的?後面的populationChange方法又是幹什麼用的?
三、popupTemplate的content屬性
直接看下文代碼塊中的content屬性:
var popupTemplate = {
  title: "Population in {NAME}",
  content: "As of 2010, the population in this area was <b>{POP2010:NumberFormat}</b> " +
    "and the density was <b>{POP10_SQMI:NumberFormat}</b> sq mi. " +
    "As of 2013, the population here was <b>{POP2013:NumberFormat}</b> " +
    "and the density was <b>{POP13_SQMI:NumberFormat}</b> sq mi. <br/> <br/>" +
    "Percent change is {POP2013:populationChange}"
};
可以看到,有5個{}在content中,也就是說有5個值是動态變化的,在彈窗時會改變。
前4個使用的格式是NumbreFormat,當然這個是可以指定一個方法給它的,
就是第5個{}中的POP2013字段,它的格式就指定為了populationChange方法。我們來看看populationChange方法:
populationChange = function(value, key, data) {
  var diff = data.POP2013 - data.POP2010;
  var pctChange = (diff * 100) / data.POP2010;
  var result = diff > 0 ? "up.png" : "down.png";

  return "<img src='" + result + "'/>" +
    "<span style='color: " +
    (pctChange < 0 ? "red" : "green") + ";'>" +
    number.format(pctChange, {
      places: 3
    }) +
    "%</span>";
}
result中有一個三元判斷符 “A?B:C”,意思是若A為真,則選擇B作為結果,否則選擇C。
看樣子就知道diff就是變化數了,它>0就"up.png",否則就"down.png"。
傳回一串html代碼,看就知道是什麼了,這與我們在開頭看到的例子的結果一緻。
這個方法的參數中data即各個字段的集合。
四、總結
popupTemplate的content中如何用自己的規則去控制樣式?
這樣即可對變化值進行格式自定義控制:
content: "...{字段:Function名}..."
在代碼後補全同名方法即可。
就是這麼簡單!熟悉html組織文本樣式的童鞋就能創造更多好看複雜的樣式了。
給出源代碼:
<!DOCTYPE html>
<html>
<head>
  <meta http-equiv="Content-Type" content="text/html; charset=utf-8">
  <meta name="viewport" content="initial-scale=1, maximum-scale=1,user-scalable=no">
  <title>PopupTemplate Function - 4.2</title>

  <link rel="stylesheet" href="https://js.arcgis.com/4.2/esri/css/main.css">
  <script src="https://js.arcgis.com/4.2/"></script>

  <style>
    html,
    body,
    #viewDiv {
      padding: 0;
      margin: 0;
      height: 100%;
      width: 100%;
    }
  </style>

  <script>
    var populationChange;
    require([
        "esri/Map",
        "esri/views/MapView",
        "esri/layers/Layer",
        "dojo/dom",
        "dojo/number",
        "dojo/on",
        "dojo/domReady!"
      ],
      function(
        Map, MapView, Layer,
        dom, number, on
      ) {
        var map = new Map({
          basemap: "dark-gray"
        });

        // Create the MapView
        var view = new MapView({
          container: "viewDiv",
          map: map,
          zoom: 7,
          center: [-87, 34]
        });

        Layer.fromPortalItem({
          portalItem: { // autocast as esri/portal/PortalItem
            id: "e8f85b4982a24210b9c8aa20ba4e1bf7"
          }
        }).then(function(layer) {
          // add the layer to the map
          map.add(layer);

          // create a new popupTemplate for the layer
          // format the numeric field values using out of the box
          // NumberFormat function. Call populationChange() custom
          // function to calculate percent change for the county.
          var popupTemplate = {
            title: "Population in {NAME}",
            content: "As of 2010, the population in this area was <b>{POP2010:NumberFormat}</b> " +
              "and the density was <b>{POP10_SQMI:NumberFormat}</b> sq mi. " +
              "As of 2013, the population here was <b>{POP2013:NumberFormat}</b> " +
              "and the density was <b>{POP13_SQMI:NumberFormat}</b> sq mi. <br/> <br/>" +
              "Percent change is {POP2013:populationChange}"
          };

          layer.popupTemplate = popupTemplate;

          populationChange = function(value, key, data) {
            // calculate the population percent change from 2010 to 2013.
            var diff = data.POP2013 - data.POP2010;
            var pctChange = (diff * 100) / data.POP2010;
            var result = diff > 0 ? "up.png" : "down.png";

            // add green arrow if the percent change is positive.
            // red arrow for negatice percent change.
            return "<img src='" + result + "'/>" +
              "<span style='color: " +
              (pctChange < 0 ? "red" : "green") + ";'>" +
              number.format(pctChange, {
                places: 3
              }) +
              "%</span>";
          }
        });
      });
  </script>
</head>
<body>
  <div id="viewDiv"></div>
</body>
</html>
本例html源代碼