機器學習的過程中很多時候需要用到類似透視表的功能。Pandas提供了pivot和pivot_table實作透視表功能。相對比而言,pivot_table更加強大,在實作透視表的時候可以進行聚類等操作。
pivot_table幫助位址:
https://pandas.pydata.org/pandas-docs/stable/reference/api/pandas.pivot_table.html 官方給的幾個例子:df = pd.DataFrame({"A": ["foo", "foo", "foo", "foo", "foo",
... "bar", "bar", "bar", "bar"],
... "B": ["one", "one", "one", "two", "two",
... "one", "one", "two", "two"],
... "C": ["small", "large", "large", "small",
... "small", "large", "small", "small",
... "large"],
... "D": [1, 2, 2, 3, 3, 4, 5, 6, 7],
... "E": [2, 4, 5, 5, 6, 6, 8, 9, 9]})
df
A B C D E
0 foo one small 1 2
1 foo one large 2 4
2 foo one large 2 5
3 foo two small 3 5
4 foo two small 3 6
5 bar one large 4 6
6 bar one small 5 8
7 bar two small 6 9
8 bar two large 7 9
This first example aggregates values by taking the sum.
table = pd.pivot_table(df, values='D', index=['A', 'B'],
... columns=['C'], aggfunc=np.sum)
table
C large small
A B
bar one 4.0 5.0
two 7.0 6.0
foo one 4.0 1.0
two NaN 6.0
We can also fill missing values using the fill_value parameter.
... columns=['C'], aggfunc=np.sum, fill_value=0)
bar one 4 5
two 7 6
foo one 4 1
two 0 6
The next example aggregates by taking the mean across multiple columns.
table = pd.pivot_table(df, values=['D', 'E'], index=['A', 'C'],
... aggfunc={'D': np.mean,
... 'E': np.mean})
D E
A C
bar large 5.500000 7.500000
small 5.500000 8.500000
foo large 2.000000 4.500000
small 2.333333 4.333333
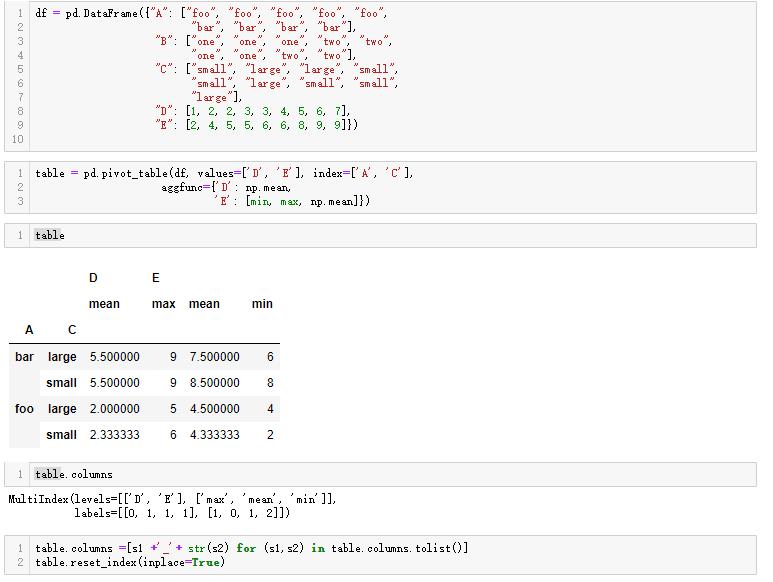
We can also calculate multiple types of aggregations for any given value column.
... 'E': [min, max, np.mean]})
D E
mean max mean min
bar large 5.500000 9.0 7.500000 6.0
small 5.500000 9.0 8.500000 8.0
foo large 2.000000 5.0 4.500000 4.0
small 2.333333 6.0 4.333333 2.0
現在的一個問題是,處理後的dataframe的columns是多層的,例如最後一個例子的columns是這個樣子的:
table.columns:
MultiIndex(levels=[['D', 'E'], ['max', 'mean', 'min']],
labels=[[0, 1, 1, 1], [1, 0, 1, 2]])
為了後續的運算,我們經常希望它能簡化,便于處理。也就是說吧columns拍平。大家可以這麼處理:
table.columns =[s1 +'_'+ str(s2) for (s1,s2) in table.columns.tolist()]
table.reset_index(inplace=True)
效果如下:
table.columns
Index(['A', 'C', 'D_mean', 'E_max', 'E_mean', 'E_min'], dtype='object')
效果如圖:
![TestLink導出用例轉換工具(XML2Excel)[圖]](data:image/gif;base64,R0lGODlhAQABAIAAAP///wAAACwAAAAAAQABAAACAkQBADs=)