背景
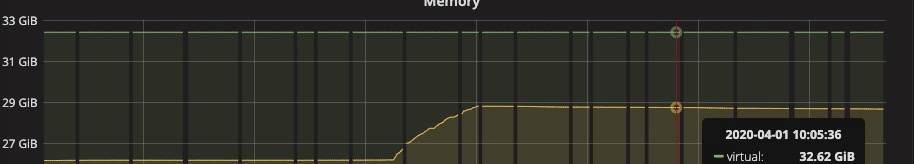

從監控看 Secondary 使用的實體記憶體比 Primary 多 11GB 左右,
基本的記憶體分析可以先看團隊另一位同學寫的這個
排查文檔,
使用者沒有設定在備庫讀,Secondary 基本沒有流量,隻有複制的流量,連接配接數也不多,基本排除是業務行為導緻 Secondary 記憶體高,是以懷疑和 tcmalloc 配置設定器的緩存行為有關。
排查
檢視Primary 和 Secondary 的 serverStatus.tcmalloc 輸出,
Primary,
mgset-25489817:PRIMARY> db.serverStatus().tcmalloc
{
        "generic" : {
                "current_allocated_bytes" : NumberLong("16296822448"),
                "heap_size" : NumberLong("34201272320")
        },
        "tcmalloc" : {
                "pageheap_free_bytes" : 933314560,
                "pageheap_unmapped_bytes" : NumberLong("15870619648"),
                "max_total_thread_cache_bytes" : NumberLong(1073741824),
                "current_total_thread_cache_bytes" : 543050048,
                "total_free_bytes" : NumberLong(1100498976),
                "central_cache_free_bytes" : 557461008,
                "transfer_cache_free_bytes" : 4096,
                "thread_cache_free_bytes" : 543031184,
                "aggressive_memory_decommit" : 0,
                "pageheap_committed_bytes" : NumberLong("18330652672"),
                "pageheap_scavenge_count" : 22937964,
                "pageheap_commit_count" : 31247638,
                "pageheap_total_commit_bytes" : NumberLong("218141866151936"),
                "pageheap_decommit_count" : 23394903,
                "pageheap_total_decommit_bytes" : NumberLong("218123535499264"),
                "pageheap_reserve_count" : 9872,
                "pageheap_total_reserve_bytes" : NumberLong("34201272320"),
                "spinlock_total_delay_ns" : NumberLong("113428202936"),
Secondary,
mgset-25489817:SECONDARY> db.serverStatus().tcmalloc
{
        "generic" : {
                "current_allocated_bytes" : NumberLong("16552694552"),
                "heap_size" : NumberLong("33373687808")
        },
        "tcmalloc" : {
                "pageheap_free_bytes" : NumberLong("11787452416"),
                "pageheap_unmapped_bytes" : NumberLong("4039823360"),
                "max_total_thread_cache_bytes" : NumberLong(1073741824),
                "current_total_thread_cache_bytes" : 113279256,
                "total_free_bytes" : 993717480,
                "central_cache_free_bytes" : 879823248,
                "transfer_cache_free_bytes" : 614976,
                "thread_cache_free_bytes" : 113279256,
                "aggressive_memory_decommit" : 0,
                "pageheap_committed_bytes" : NumberLong("29333864448"),
                "pageheap_scavenge_count" : 2605518,
                "pageheap_commit_count" : 4694997,
                "pageheap_total_commit_bytes" : NumberLong("672231747584"),
                "pageheap_decommit_count" : 3544502,
                "pageheap_total_decommit_bytes" : NumberLong("642897883136"),
                "pageheap_reserve_count" : 25284,
                "pageheap_total_reserve_bytes" : NumberLong("33373687808"),
                "spinlock_total_delay_ns" : NumberLong("3132393632"),
我們重點關注 *_free_bytes 的輸出項,其中,
- pageheap_free_bytes:Number of bytes in free, mapped pages in page heap. These bytes can be used to fulfill allocation requests. They always count towards virtual memory usage, and unless the underlying memory is swapped out by the OS(線上目前沒有開啟 swap), they also count towards physical memory usage.
- total_free_bytes =
central_cache_free_bytes + transfer_cache_free_bytes + thread_cache_free_bytes
- 是以如果檢視 tcmalloc cache 了多少記憶體,需要看 pageheap_free_bytes + total_free_bytes
最後,對比一下 Secondary 和 Primary 的 serverStatus 輸出,可以看到total_free_bytes二者是差不多的,都在 1GB 左右,但是pageheap_free_bytes ,Secondary 比 Primary 多了 11GB 左右,和前面 OS 層面觀察到的 RSS 內插補點一緻。
關于 central_cache_free_bytes 、thread_cache_free_bytes 、 thread_cache_free_bytes的含義也列一下,這個代碼裡面沒有解釋,在其他地方找到了,
- central_cache_free_bytes, Number of free bytes in the central cache that have been assigned to size classes. They always count towards virtual memory usage, and unless the underlying memory is swapped out by the OS, they also count towards physical memory usage. This property is not writable.
- transfer_cache_free_bytes, Number of free bytes that are waiting to be transfered between the central cache and a thread cache. They always count towards virtual memory usage, and unless the underlying memory is swapped out by the OS, they also count towards physical memory usage. This property is not writable.
- thread_cache_free_bytes, Number of free bytes in thread caches. They always count towards virtual memory usage, and unless the underlying memory is swapped out by the OS, they also count towards physical memory usage. This property is not writable.
優化
阿裡雲 MongoDB 實作了一個 tcmallocRelease 指令(後端可執行,不對外部使用者提供),背後是調用 tcmalloc 的ReleaseFreeMemory()進行 PageHeap 的回收,不過這個指令在執行過程中會鎖住整個 PageHeap,可能導緻其他需要配置設定記憶體的請求 hang 住,線上執行要小心。另外,如果對這部分 cache 住的記憶體不是特别敏感,不建議執行,畢竟不是真的浪費了,也減少了後續需要調用系統調用的次數。
此外,這個方法不影響 Central Cache 和 Thread Cache。關于tcmalloc cache 記憶體歸還作業系統的政策和時機,比較複雜,詳細的資料可以參考這個
文章。
我們在上述執行個體的Hidden 節點執行
db.adminCommand({tcmallocRelease: 1})
指令,可以觀察到pageheap_free_bytes下降了 90%以上,
before,
mgset-25489817:SECONDARY> db.serverStatus().tcmalloc
{
        "generic" : {
                "current_allocated_bytes" : NumberLong("16549856240"),
                "heap_size" : NumberLong("34105942016")
        },
        "tcmalloc" : {
                "pageheap_free_bytes" : NumberLong("7499571200"),
                "pageheap_unmapped_bytes" : NumberLong("9387900928"),
                "max_total_thread_cache_bytes" : NumberLong(1073741824),
                "current_total_thread_cache_bytes" : 133710112,
                "total_free_bytes" : 668613648,
                "central_cache_free_bytes" : 534325360,
                "transfer_cache_free_bytes" : 578176,
                "thread_cache_free_bytes" : 133710112,
after,
mgset-25489817:SECONDARY> db.serverStatus().tcmalloc
{
        "generic" : {
                "current_allocated_bytes" : NumberLong("16546167280"),
                "heap_size" : NumberLong("34105942016")
        },
        "tcmalloc" : {
                "pageheap_free_bytes" : 38395904,
                "pageheap_unmapped_bytes" : NumberLong("16852795392"),
                "max_total_thread_cache_bytes" : NumberLong(1073741824),
                "current_total_thread_cache_bytes" : 134981800,
                "total_free_bytes" : 668583440,
                "central_cache_free_bytes" : 533437608,
                "transfer_cache_free_bytes" : 164032,
"thread_cache_free_bytes" : 134981800, 官方 JIRA Issue
查了一下有幾個,但是我們重點關注這個,
https://jira.mongodb.org/browse/SERVER-37541, 這個 issue 實際上是對今天這裡讨論的問題的一個彙總,主要包括兩方面的原因,
- Fragmentation,即碎片導緻,這個問題大神 Bruce Lucas 開了一個 jira ,但是 mongodb 團隊回報說是不在高優先級 list 上,是以 backlog 了(PS:優化記憶體碎片率是世界性難題,tcmalloc/jemalloc 都不能做到完美,可能要優化确實很困難)。
- 另外一個就是記憶體配置設定器的緩存行為,tcmalloc 在向作業系統歸還記憶體時,是比較 "reluctant" 的,而且有時候還會達到一個臨界點突然歸還記憶體,導緻 性能抖動 ,可以配置server parameter tcmallocAggressiveMemoryDecommit 來進行更激進的記憶體回收,但是 MongoDB 團隊測試發現有性能問題,是以預設沒有開啟。