對于深度學習而言,很多任務都是與數字圖形處理打交道。這類任務的資料集一般是由很多張圖像構成,有時候,當原始圖像不能直接送入模型中時,需要對其進行一定的預處理操作,這時候就不得不向大家介紹一個十分有用的軟體包OpenCV,用它處理圖像起來非常友善,OpenCV是一個基于BSD許可發行的跨平台計算機視覺庫,它輕量且高效,是由一系列C函數和少量C++類構成,支援Python、MATLAB等語言接口,内部包含了很多圖像處理的相關算法。下面将向大家介紹如何使用NumPy和OpenCV對數字圖像進行簡單的處理方法:
關于像素的一些知識
在程式世界裡,圖像輸入到計算機中時,與人眼所見的圖像的形式不太一樣。計算機将圖像存儲為類似于馬賽克的小方塊,就像古老的方塊馬賽克藝術的形式。如果方形塊太大,那麼就很難制作出光滑的邊緣和曲線。使用的方塊越小,則越平滑,或者說圖像的像素就越少,方塊的大小有時候也被稱為圖像的分辨率。
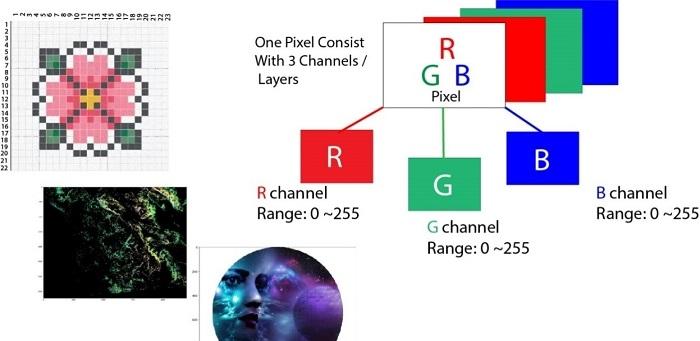
矢量圖像是存儲圖像的一些不同方法,目的是為了避免與像素相關的問題。但是,即使是矢量圖像,最終也會顯示為像素級的馬賽克。像素一詞表示圖像元素,描述每個像素的簡單方法是使用三種顔色的組合,即紅色(Red),綠色(Green),藍色(Blue),即我們平時所說的RGB圖像。
在RGB圖像中,每個像素由分别與紅色,綠色,藍色的值相關聯的三個8比特數表示。假設使用放大鏡觀察,如果我們放大圖檔,就會看到圖檔是由微小的光點或更加具體的像素組成,更有趣的是,看到的那些小光點實際上是多個微小不同顔色的小光點,且顔色隻有紅色、綠色和藍色。
假設現在從遠處觀察,建立一張圖像,可以看到一張圖像實際上由像素點值的開關決定(像素值為1表示開,像素值為0表示關),這些開關組合建立了圖像,基本上,我們每天在螢幕上看到的圖像都是這種。
每張圖像都以數字形式的像素組成,像素是構成圖檔的最小資訊機關,通常是圓形或方形,且位于二維網格中。
現在,如果RGB三個值都處于全強度,這意味着其組合值為255,該值表示為白色,如果所有三種顔色都被減弱,或者值設定為0,其值表示為黑色。反過來,三者的不同組合将為我們提供不同特定的像素顔色。由于每個數字都是8比特,是以像素值的取值範圍為0-255,從下圖可以看到,但R的強度為37.3%,G的強度為45.9%,B的強度為18.8%時,組合成的顔色為深綠(dark green)。

三種顔色的不同組合将産生不同的顔色,由于每個值可以具有256個不同的強度或亮度值,是以總共有1680萬(256 x 256 x 256)種不同組合。
圖像的基本知識介紹完畢後進入正題,以下内容将包含Numpy非常基本的圖像資料分析、還有一些Python資料包,比如imageio,matplotlib等。本系列部落格内容結構如下,先介紹前三個部分:
- 導入圖像并觀察其屬性
- 拆分圖層
- 灰階化
- 對像素值使用邏輯運算符
- 使用邏輯運算符進行掩碼
- 衛星圖像資料分析
導入圖像
下面加載圖像并觀察其各種屬性。注意,在輸入下面代碼請確定好已經安裝好對應的python資料包。
if__name__=='__main__':
importimageio
importmatplotlib.pyplotasplt
%matplotlibinline

pic=imageio.imread('F:/demo_2.jpg')
plt.figure(figsize=(15,15))

plt.imshow(pic) 觀察圖像的基本屬性
rint('Type of the image : ',type(pic))
print()
print('Shape of the image : {}'.format(pic.shape))
print('Image Hight {}'.format(pic.shape[0]))
print('Image Width {}'.format(pic.shape[1]))
print('Dimension of Image {}'.format(pic.ndim))
其輸出
Type of the image :<class 'imageio.core.util.Image'>

Shape of the image : (562, 960, 3)
Image Hight 562
Image Width 960
Dimension of Image 3
ndarray的形狀表明它是一個三維矩陣,輸出結果的前兩個數字分别表示高度(height)和寬度(width),第三個數字(即3)表示是該圖像是三通道彩色圖:紅色、綠色和藍色。是以,如果我們計算RGB圖像的大小,則總像素大小将是
weiheigh x width x 3
。
print('Image size {}'.format(pic.size))

print('Maximum RGB value in this image {}'.format(pic.max()))

print('Minimum RGB value in this image {}'.format(pic.min()))


Image size 1618560

Maximum RGB value in this image 255

Minimum RGB value in this image 0
這些值對于驗證而言是很重要的,因為8位顔色強度不能超出0到255範圍。
使用圖檔可以配置設定變量,此外還可以通路圖像的任何特定像素值,并且還可以分别通路每個RGB通道。
pic[100, 50 ]

Image([109, 143,  46], dtype=uint8)
在這種情況下:R = 109、G = 143、 B = 46,從這個配置可以看出該像素中有很多綠色,也可以通過三個通道的索引值來從中選擇出一個。根據一般規定:
- 索引0表示紅色通道
- 索引1表示綠色通道
-
索引2表示藍色通道
但在OpenCV中,Images并不是按照RGB的順序規定,而是BGR。 imageio.imread将圖像加載為RGB(或RGBA),但OpenCV假定圖像為BGR或BGRA(BGR是OpenCVcolour的預設的式)。
print('Value of only R channel {}'.format(pic[ 100, 50, 0]))

print('Value of only G channel {}'.format(pic[ 100, 50, 1]))

print('Value of only B channel {}'.format(pic[ 100, 50, 2]))

Value of only R channel 109

Value of only G channel 143

Value of only B channel 46
現在快速檢視整個圖像中每個通道表示的圖像。
plt.title('R channel')

plt.ylabel('Height {}'.format(pic.shape[0]))

plt.xlabel('Width {}'.format(pic.shape[1]))


plt.imshow(pic[ : , : , 0])

plt.show() plt.title('G channel')
plt.ylabel('Height {}'.format(pic.shape[0]))
plt.xlabel('Width {}'.format(pic.shape[1]))
plt.imshow(pic[ : , : , 1])
plt.show() plt.title('B channel')
plt.ylabel('Height {}'.format(pic.shape[0]))
plt.xlabel('Width {}'.format(pic.shape[1]))
plt.imshow(pic[ : , : , 2])
plt.show() 下面,也可以更改RGB的數值。例如,将下面行的紅色、綠色、,藍色圖層的值全部設定為全強度,即取值為255。
- R通道:第100行到110行
- G通道:第200行到210行
-
B通道:行300行到310行
本次測試隻在一張圖像上進行綜合處理,友善我們同時檢視每個通道的值對圖像的影響。
pic =imageio.imread('F:/demo_2.jpg')
pic[50:150 , : , 0] =255# full intensity to those pixel's R channel

plt.figure( figsize= (10,10))

plt.imshow(pic)

plt.show() pic[200:300 , : , 1] =255# full intensity to those pixel's G channel
plt.figure( figsize= (10,10))
plt.imshow(pic)
plt.show() pic[350:450 , : , 2] =255# full intensity to those pixel's B channel
plt.figure( figsize= (10,10))
plt.imshow(pic)
plt.show() 為了更加清楚地對比分析,我們也改變部分列的像素值,這次測試同時更改RGB通道的值。
pic[50:450 , 400:600 , [0,1,2] ] =200

plt.figure( figsize= (10,10))

plt.imshow(pic)

plt.show() 通過以上測試,可以知道,圖像的每個像素點都是由三個整數表示。隻需要拉出圖像陣列的正确切片,就可以将圖像分割成單獨的顔色分量。
importnumpyasnp

pic=imageio.imread('F:/demo_2.jpg')

fig,ax=plt.subplots(nrows=1,ncols=3,figsize=(15,5))

forc,axinzip(range(3),ax):

# create zero matrix

split_img=np.zeros(pic.shape,dtype="uint8")# 'dtype' by default: 'numpy.float64'

# assing each channel split_img[:,:,c]=pic[:,:,c]

# display each channelax.imshow(split_img) 黑白圖像存儲在二維矩陣中,目前存在兩種類型的黑白圖像:
- 灰階:灰色陰影的範圍:0~255
-
二進制:像素為黑色或白色:0或255
灰階處理過程,就是将圖像從全彩色轉換為灰階圖。在圖像處理工具中,例如:在OpenCV中,在使用很多含住之前,需要将圖像進行灰階處理,這樣做是因為灰階處理簡化了圖像,幾乎像降噪一樣,這是因為灰階圖像中的資訊比較少。
在python中有兩種方法可以将圖像轉換為灰階。但是,更直接的方法是使用matplotlib包,該包執行的操作是擷取原始圖像的RGB值後進行權重平均。
Y' = 0.299 R + 0.587 G + 0.114 B
pic=imageio.imread('F:/demo_2.jpg')
gray=lambdargb:np.dot(rgb[...,:3],[0.299,0.587,0.114])
gray=gray(pic)
plt.figure(figsize=(10,10))
plt.imshow(gray,cmap=plt.get_cmap(name='gray'))
plt.show() 而通過GIMP将顔色轉換為灰階圖像有三種算法來完成任務:
- 亮度(Lightness)灰階等級計算為
Lightness = ½×(max(R,G,B)+ min(R,G,B))
- 照明度(Luminosity)灰階級将計算為
Luminosity= 0.21×R + 0.7×G + 0.07×B
- 平均亮度灰階級将計算為
Average Brightness=(R + G + B)÷3
下面讓我們嘗試實作一下這三個算法中的一種吧,本文選擇Luminosity。
pic=imageio.imread('F:/demo_2.jpg')

gray=lambdargb:np.dot(rgb[...,:3],[0.21,0.72,0.07])

gray=gray(pic)

plt.figure(figsize=(10,10))

plt.imshow(gray,cmap=plt.get_cmap(name='gray'))

plt.show()

print('Type of the image : ',type(gray))

print()

print('Shape of the image : {}'.format(gray.shape))

print('Image Hight {}'.format(gray.shape[0]))

print('Image Width {}'.format(gray.shape[1]))

print('Dimension of Image {}'.format(gray.ndim))

print()

print('Image size {}'.format(gray.size))

print('Maximum RGB value in this image {}'.format(gray.max()))

print('Minimum RGB value in this image {}'.format(gray.min()))

print('Random indexes [X,Y] : {}'.format(gray[100,50])) Type of the image :<class 'imageio.core.util.Image'>
Shape of the image : (562,960)
Image Height 562
Image Widht 960
Dimension of Image 2
Image size 539520
Maximum RGB value in this image 254.9999999997
Minimum RGB value in this image 0.0
Random indexes [X,Y] : 129.07 從圖中可以看到,圖像變為了灰階圖,且圖像矩陣變為了二維矩陣。
後續内容請參見“
使用Numpy和Opencv完成圖像的基本資料分析(Part II)”。
數十款阿裡雲産品限時折扣中,趕緊點選領劵開始雲上實踐吧!
作者資訊
Mohammed Innat,機器學習和資料科學研究者
本文由阿裡雲雲栖社群組織翻譯。
文章原标題《Basic Image Data Analysis Using Numpy and OpenCV – Part 1》,譯者:海棠,審校:Uncle_LLD。
文章為簡譯,更為詳細的内容,請
檢視原文