上篇部落格中給大家分享了使用Windbg進行Live Debugging:
Windbg程式調試系列4-Live Debugging
本篇中我們繼續,跟大家分享常見的應用程式高CPU使用率問題分析。
先說Windows下CPU使用率這個概念:
CPU使用率:在任務管理器的重新整理周期内CPU忙的時間與整個重新整理周期的比值。預設的重新整理周期是1s。
即1s内,反映出系統的CPU繁忙程度
我們打開Windows的任務管理器,可以看到CPU的使用率:
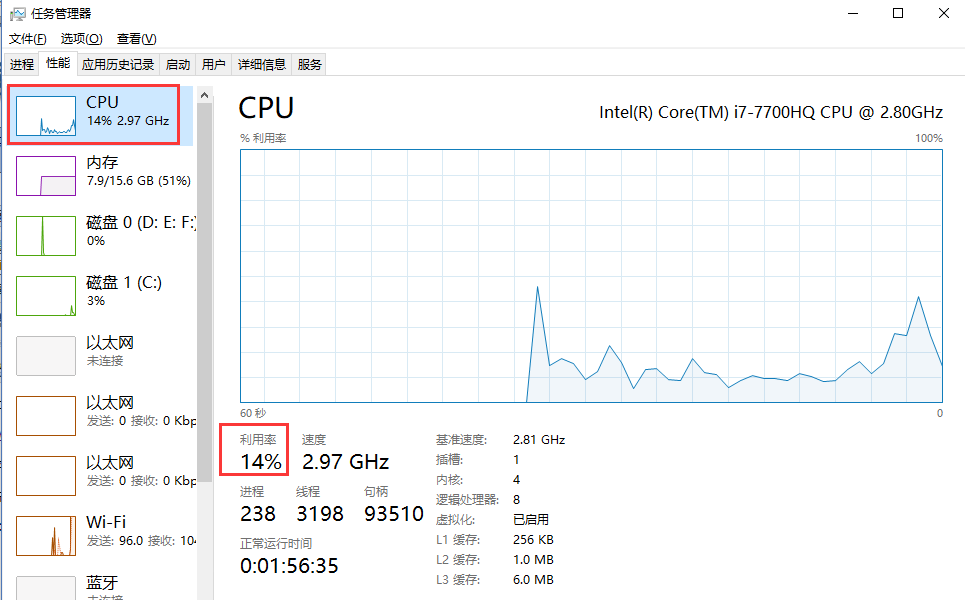
當然,這個CPU使用率是整個所有核心CPU的使用率。比如我本機是8核心的CPU。整體的CPU使用率 在某一瞬間是14%。
這個CPU使用率是如何計算出來的,有兩個重要的時間sysTime和idleTime:
sysTime:表示該時間段内總的CPU時間=CPU處于使用者态和核心态CPU時間的總和,即sysTime =kerneTimel + userTime
(注:這裡并不包括idleTime,因為當CPU處于空閑狀态時,是在核心模式下運作System Idle Process這個程序,是以kernelTime實際上已經包含了idleTime);
idleTime:表示在該時間段内CPU處于空閑狀态的時間;
CPU% = 1 – idleTime / sysTime * 100 說到這裡,我們分析一個應用的高cpu問題,更多的是:分析使用者态的CPU耗時。即,我們應用程式本身運作時消耗的CPU時間片總和。
然後,進入今天的正題,使用Windbg分析高CPU問題:
一、首先我們用C#寫一個Any CPU架構的Console模拟程式
using System;
using System.Collections.Generic;
using System.Linq;
using System.Text;
using System.Threading;
using System.Threading.Tasks;

namespace HighCpuDemo
{
    class Program
    {
        static void Main(string[] args)
        {
            var normalThread = new Thread(NormalMethod);
            normalThread.Start();

            var longRunningThread = new Thread(LongRunningMethod);
            longRunningThread.Start();

            Console.ReadKey();
        }

        private static void NormalMethod()
        {
            int a = 0;
            int b = 100000;
            var list = new List<int>();
            for (int i = 0; i < b; i++)
            {
                a += i;
                list.Add(a);
                var max = list.Max();
                var min = list.Min();
                var avg = list.Average();
                Console.WriteLine(string.Format("Thread:{0}, writeline:{1}", Thread.CurrentThread.ManagedThreadId, a));

                //休息一下
                Thread.Sleep(100);
            }
        }

        private static void LongRunningMethod()
        {
            for (int c = 0; c < 100000; c++)
            {
                int a = 0;
                int b = 100000;
                var list = new List<int>();
                for (int i = 0; i < b; i++)
                {
                    a += i;
                    list.Add(a);
                    var max = list.Max();
                    var min = list.Min();
                    var avg = list.Average();
                    Console.WriteLine(string.Format("Thread:{0}, writeline:{1}", Thread.CurrentThread.ManagedThreadId, a));
                }
            }
        }
    }
}
代碼中有兩個線程,一個是“正常”的計算輸出線程NormalThread(每次輸出,會休息一下 100s),一個是長時間運作的線程LongRunningThread,一直在計算,輸出。
代碼寫好之後,設定為Any CPU架構,支援64位模式:

看程式輸出:
很明顯,3号線程是NormalThread, 4号線程是LongRunningThread。
二、 檢視應用程序的CPU使用率
從任務管理器上,能夠發現,HighCpuDemo這個程序的CPU使用率是12%
三、間隔30s,抓兩個Dump
這裡有個問題:為什麼要間隔一段時間抓2個dump?我們先把問題放在這。
四、使用Windbg分析兩個Dump檔案,使用!runaway找到最消耗CPU時間片的線程,然後優化
Windbg打開這兩個Dump後,分别執行以下指令:
0:000> .loadby sos clr
0:000> !runaway
對比看着兩個Dump的輸出:
第一個Dump:
Debug session time: Sun Nov 25 20:16:39.000 2018 (GMT+8)
System Uptime: 0 days 3:03:00.195
Process Uptime: 0 days 0:08:31.000
.............................
Loading unloaded module list
.
ntdll!ZwDeviceIoControlFile+0x14:
00007ffc`c01b03a4 c3              ret
0:000> .loadby sos clr
0:000> !runaway
 User Mode Time
  Thread       Time
   4:3758      0 days 0:07:38.531
   3:325c      0 days 0:00:00.390
   0:2248      0 days 0:00:00.015
   6:4c3c      0 days 0:00:00.000
   5:17d0      0 days 0:00:00.000
   2:278       0 days 0:00:00.000
   1:2424      0 days 0:00:00.000
第二個Dump:
Debug session time: Sun Nov 25 20:17:06.000 2018 (GMT+8)
System Uptime: 0 days 3:03:27.136
Process Uptime: 0 days 0:08:58.000
.............................
Loading unloaded module list
.
ntdll!ZwDeviceIoControlFile+0x14:
00007ffc`c01b03a4 c3              ret
0:000> .loadby sos clr
0:000> !runaway
 User Mode Time
  Thread       Time
   4:3758      0 days 0:08:01.984
   3:325c      0 days 0:00:00.406
   0:2248      0 days 0:00:00.015
   6:4c3c      0 days 0:00:00.000
   5:17d0      0 days 0:00:00.000
   2:278       0 days 0:00:00.000
   1:2424      0 days 0:00:00.000
這裡有個關鍵的Windbg指令 !runaway, 它有什麼作用,輸出的是什麼:
This extension is a quick way to find out which threads are spinning out of control or consuming too much CPU time.

The display identifies each thread by the debugger's internal thread numbering and by the thread ID in hexadecimal. The debugger IDs are also shown.

Here is an example:


0:001> !runaway 7

 User Mode Time
 Thread       Time
 0:55c        0:00:00.0093
 1:1a4        0:00:00.0000

 Kernel Mode Time
 Thread       Time
 0:55c        0:00:00.0140
 1:1a4        0:00:00.0000

 Elapsed Time
 Thread       Time
 0:55c        0:00:43.0533
 1:1a4        0:00:25.0876
使用這個指令,可以檢視每個線程的"使用者态"CPU使用時間:
從上面兩個Dump中,我們能看出,4号線程 User Mode Time 一直在增加,我們看看4号線程的堆棧:
0:000> ~4s
*** WARNING: Unable to verify checksum for System.Core.ni.dll
System_Core_ni+0x588b44:
00007ffc`a4268b44 488b4de8        mov     rcx,qword ptr [rbp-18h] ss:000000c1`df0ff2a8=000001d4633eb280
0:004> !clrstack
OS Thread Id: 0x3758 (4)
        Child SP               IP Call Site
000000c1df0ff280 00007ffca4268b44 System.Linq.Enumerable.Min(System.Collections.Generic.IEnumerable`1<Int32>)
000000c1df0ff2d0 00007ffc4b930660 *** WARNING: Unable to verify checksum for HighCpuDemo.exe
HighCpuDemo.Program.LongRunningMethod() [c:\users\zhougq\documents\visual studio 2015\Projects\HighCpuDemo\Program.cs @ 54]
000000c1df0ff3a0 00007ffca7e24770 System.Threading.ExecutionContext.RunInternal(System.Threading.ExecutionContext, System.Threading.ContextCallback, System.Object, Boolean) [f:\dd\ndp\clr\src\BCL\system\threading\executioncontext.cs @ 954]
000000c1df0ff470 00007ffca7e24604 System.Threading.ExecutionContext.Run(System.Threading.ExecutionContext, System.Threading.ContextCallback, System.Object, Boolean) [f:\dd\ndp\clr\src\BCL\system\threading\executioncontext.cs @ 902]
000000c1df0ff4a0 00007ffca7e245d2 System.Threading.ExecutionContext.Run(System.Threading.ExecutionContext, System.Threading.ContextCallback, System.Object) [f:\dd\ndp\clr\src\BCL\system\threading\executioncontext.cs @ 891]
000000c1df0ff4f0 00007ffca7eacff2 System.Threading.ThreadHelper.ThreadStart() [f:\dd\ndp\clr\src\BCL\system\threading\thread.cs @ 111]
000000c1df0ff748 00007ffcaaf35863 [GCFrame: 000000c1df0ff748]
000000c1df0ffa98 00007ffcaaf35863 [DebuggerU2MCatchHandlerFrame: 000000c1df0ffa98]
正如我們代碼中所寫的,LongRunningMethod方法一直在執行、消耗CPU資源。
定位到代碼問題,就可以進一步修改代碼,解決問題了。
以上就是使用Windbg 調試高CPU問題的方法思路,總結一下:
1. 檢視應用程序的CPU使用率
2. 間隔一段時間,抓兩個Dump
3. 使用Windbg分析兩個Dump檔案,使用!runaway找到最消耗CPU時間片的線程,然後優化
分享給大家。
周國慶
2018/11/25